Friday, April 28, 2006
Trading Ideas & Picks
Day Trading Google Inc (NASDAQ: GOOG)
Since gapping up after their earnings report, GOOG has gradually moved lower filling the gap more and more each day. It looks like today may be the day it finally fills it all the way...
Trading Ideas - Read More
Keep an eye on Brocade Communication Systems Inc (BRCD)
ABRCD has broke outside of its up trend and is now trading sideways with consistent support at 6...
Trading Ideas - Read More
Technical Indicators
Moving Average, Triple Exponential
The Triple Exponential Moving Average (TRIX) is an oscillator used to identify oversold and overbought markets as well as a momentum indicator. For use as an oscillator look for a positive value to indicate an overbought market and a negative value indicate an oversold market. When TRIX is used as a momentum indicator, a positive value suggests increasing momentum just as a negative value suggests momentum is decreasing. Some believe that the TRIX crossing above the zero line is a buy signal and a closing below the zero line is a sell signal. Divergence between price and TRIX can also indicate significant turning points in the market.
Read More...
NASDAQ Chart of the Day

CELG got an upside break from a clear triangle consolidation today, which could be the spark to another big rally. Watch for continued strength above 40.00.

Recent Picks / Trading Ideas
| Swing Trade of the Week Apr 27 BBBY: Stock recently surged down through the 20 day EMA and has since traded at the lower end representing a consolidation and possible setup for further downside ... |
| Stochastics Reversal Apr 24 After falling sharply early this month, SFD regained some of its earlier losses as it recovered in a rounding bottom ... |
| Weekly Market Update April 24 The market, again, unable to break the 1750 highs, has pulled back, created a double top. If we break below the low of 04/17/2006, the 1684 level, it will confirm the down trend ... |
| Swing Trade of the Week Apr 20 NTAP: Stock surged through a resistance area with a bullish green candle then traded at the upper end of the candle, representing a consolidation and possible setup for further upside ... |
| Stochastic Reversal and Bullish MACD April 13 CEPH has bullish MACD and stochastic signals ... |
| Trading Ideas for today Apr 11 Momentum in the short run, according to our momentum models, is a headwind, and the long-term momentum measures are weakening ... |
| Weekly Market Recap April 9 The longer term trend is up...we do note a potentially bearish sign with the market reversing off of intraday Multi-Year highs and closing below the 20 day EMA. ... |
| DO - Now Ready to Move to $95 Area April 5 This stock acts very well for an oil stock and is now ready to move closer to the $95 area ... |
| Monthly Market Recap April 3 The Macro weekly uptrend is still bullish, the longer term trend is up. Market pulled back to test the 20 day EMA and reversed with a bullish breakout candle .. |
Daily Market Commentary
Updated Thursday, 4/27 for Friday's market
Volatile Session
Read More...
Updated Thursday, 4/27 for Friday's market
| Key DOW Levels for 4/28 | |
| UP | Above 11,425 |
| DN | Below 11,250 |
Volatile Session
- Dow trades back and forth in highly volatile session, holds at key 11,400 level.
- NASDAQ and S&P each closed a crazy session with gains today, but continue to hold beneath breakout points. Look for a solid breakout to establish a new uptrend soon. Otherwise, further volatility will brew within the current ranges.
Summary
The Dow closed a wild session with a modest gain, but the index held firmly beneath major resistance at 11,400. Look for the index to continue to struggle in this zone until clear direction is established. A break from 11,425 or 11,370 should yield nice movement tomorrow.
Thursday, April 27, 2006
Trading Signals of the Day
Bullish Reversal Triggers
Reversal bars are an objective technique used to time the entry of a trade. Read More...
http://daily-stocks.netfirms.com/daily-trading-triggers.htm
BBBY: Stock has been experiencing a bearish trend under the 5 day EMA ever since a big gap up in early April. Stock recently surged down through the 20 day EMA with a bearish colored candle. Stock has since traded at the lower end of the bearish colored candle, representing a consolidation and possible setup for further downside... Read More
Trading Ideas & Picks
Day Trading Starbucks Corporation (NASDAQ: SBUX)
Day Trading Starbucks Corporation (NASDAQ: SBUX)
After trending up for a 3 month period, SBUX broke the up trend but was able to pull back and close above it. The next day it opened higher but quickly fell, traded sideways for most of the day, and closed below the trend line... Trading Ideas - Read More
Trading Ideas & Picks
A Win-Win for Wynn Resorts (NASDAQ: WYNN)
A Win-Win for Wynn Resorts (NASDAQ: WYNN)
WYNN has been up trending for quite some time now. The stock has recently been in consolidation mode with support at 75 and resistance at 80, likely taking a break before going higher... Trading Ideas - Read More
Daily Market Commentary
Updated Wednesday, 4/26 for Thursday's market
Upside Reversal
Updated Wednesday, 4/26 for Thursday's market
| Key DOW Levels for 4/27 | |
| UP | Above 11,425 |
| DN | Below 11,250 |
Upside Reversal
- Dow breaks back above 10,300, holds at highs of session.
- NASDAQ continues to build out within the boundaries of a clear consolidation; while the S&P gained ground on the day. A clean breakout from the NASDAQ triangle could influence broader market movement.
Summary
The Dow closed the day with a nice gain after opening the session sharply higher. The index continues to hold within the boundaries of 11,250 and 11,400, which we will continue to watch for big movement. Continued overall strength should be seen as long as 11,250 remains in tact.
Read More...
Wednesday, April 26, 2006
Technical Indicators
Money Flow Index
Money Flow Index
The Money Flow Index is another momentum indicator illustrating the strength of money flowing into and out of a security. While related to the Relative Strength Index, the Money Flow Index accounts for volume while the RSI only incorporates pricing information.
Read More...
Read More...
Trading Ideas & Picks
Ameriserv Financial Inc (ASRV) Ripe for the Picking
ASRV is a small cap stock with low volume action. We typically stay away from low volume stocks, but this is at least worth noting. Being that ASRV is a low dollar stock, currently trading at 4.97, small moves translate into nice percentage gains.... Trading Ideas - Read More
Chart of the Week
Good Management Driving Strong Returns
The executives at Leucadia have done a tremendous job of creating shareholder value by buying substantial stakes in undervalued securities, and then engaging some excellent managers to oversee turnarounds. Over the nearly 20 years that the stock has traded publicly, it has earned a better than 30% annualized return. Read More...
Trading Ideas & Picks
YHOO has been trading sideways since it gapped up nicely last Wednesday. Although the trend has been sideways, it appears to be showing more weakness than strength...Trading Ideas - Read More
NASDAQ Chart of the Day

Daily Trading Signals
ARRS is winding up within the boundaries of a large triangle range. A breakout from this range could lead to big movement. Watch 13.65 up, and 12.50 down.

Daily Trading Signals
Daily Market Commentary
Updated Tuesday, 4/25 for Wednesday's market
Sloppy Session
- Dow drags lower in volatile and sloppy session.
Read More...
Updated Tuesday, 4/25 for Wednesday's market
| Key DOW Levels for 4/26 | |
| UP | Above 11,350 |
| DN | Below 11,250 |
Sloppy Session
- Dow drags lower in volatile and sloppy session.
- NASDAQ and S&P each pushed slowly lower today, but really do not look poised a big decline. The indexes are holding lows well, which could eventually lead to a nice upside recovery.
Summary
The Dow ended the day near the lows of the session, but continues to hold above the 11,250 fulcrum. This is clearly the level that will influence direction tomorrow. A break or reversal in this zone could lead to a nice trend for the session. An upside push through 11,325 could spark a nice retest of resistance at 11,400.
Read More...
Tuesday, April 25, 2006
Technical Indicators
McClellan Oscillator
McClellan Oscillator
Based on the smoothed difference between the number of advancing and declining issues on the New York Stock Exchange, similar to MACD, the McClellan Oscillator is a breadth indicator that uses advances and declines to determine the amount of participation in the movement of the stock market. One sign of a healthy bull market is a large number of stocks making moderate upward advances in price. A small number of stocks making large advances in price is a sign of a weakening bull market. This situation gives the false appearance that all is well and is the type of divergence that often signals an end to a bull market.
Read More...
Read More...
NASDAQ Chart of the Day

Daily Trading Signals
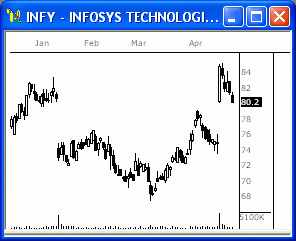
INFY has formed a volume climax top and is sitting on gap support at 80.00. A break through 80.00 could spark a much bigger sell-off ahead.
Daily Trading Signals
Daily Market Commentary
Updated Monday, 4/24 for Tuesday's market
Still Holding
- Dow trades sideways above 11,300, holds quietly to the Close.
Updated Monday, 4/24 for Tuesday's market
| Key DOW Levels for 4/25 | |
| UP | Above 11,425 |
| DN | Below 11,300 |
- Dow trades sideways above 11,300, holds quietly to the Close.
- NASDAQ and S&P each mirrored the Dow today, as each index traded sideways the entire session. Look for continued development of their respective consolidations until a solid breakout is seen. Read More...
Monday, April 24, 2006
Chart of the Week
Stochastics Reversal
After falling sharply early this month, SFD regained some of its earlier losses as it recovered in a rounding bottom. On Friday, the fast stochastic moved above the slow stochastic, signaling that the move had gained sufficient momentum to carry the stock on a rebound... Read More
NASDAQ Chart of the Day
INFA is getting a third touch at a clear resistance level at 17.10. Look for a sizeable retracement to occur from this level if a breakout does not happen.
Daily Trading Signals
Daily Trading Signals
Weekly Market Update
The market, again, unable to break the 1750 highs, has pulled back. The NDX, NASDAQ 100 index, made another attempt at breaking above the 1750 resistance level. It was unable to do so, met with serious selling and pulled back. By doing so, it actually created a double top on the chart. This could mean the beginning of a longer term down trend. If we break below the low of 04/17/2006, the 1684 level, it will confirm the down trend. Read More...
Daily Stock Picks
Bottoming - AFFX HYSL MAMA PXPL STON
(Stocks making a 52 WK low but closing higher than they opened)
Hard Slams - GLGC MATR PDFS
(Price is more than 20% down; Volume is greater than Average for 6 Months)
Overreaction - AFFX GNLB QMED
(Potential Bullish Bounce: Stocks making a 52 WK low and moving down 10% or more in one day)
More... Stock Picks Page #1
Daily Market Commentary
Consolidating
- Dow holds ground despite record highs in Crude.
| Updated Friday, 4/21 for Monday's market. | | |||||
| ||||||
- Dow holds ground despite record highs in Crude.
- NASDAQ sold off sharply today while pulling down the Dow and S&P from their highs. Look to the NASDAQ for early signs of broader market direction. Read More...
Trading Tools
Selection of trading software and trading services that can help you trade better. Find which stocks or options to trade and get accurate Buy/Sell/Sell Short signals to enter and exit trading positions in a timely manner. Whether you are a beginner or an experienced trader this products will be able to help you maximize your potential and returns.
Trading Tools
Trading Tools
![]()