Friday, May 26, 2006
Trading Tools
With VisualTrader, you will know when the market is turning, which industry groups are leading the stampede, and which charts have the best setups.
OmniTrader gives you the power to make decisions fast! It gives you real trading signals with all of the supporting information automatically displayed for you.
|
|
Technical Indicators
Herrick Payoff Index
Read More...The Herrick Payoff Index determines the amount of money flowing into or out of a futures contract by analyzing volume, price changes, and open interest changes.
When the Herrick Payoff Index is above zero it shows that money is flowing into the futures contract. When the Index is below zero it shows that money is flowing out of the futures contract.
The value of each new day is combined with the value of the previous day using a multiplying factor. Since this is a cumulative indicator the value at the beginning of the data series is zero. The value will primarily increase and decrease with the average price for each day, the amount regulated by the trading volume, changes in the number of open contracts, and changes in the average price.
The primary signal to watch for is a divergence from the price. If prices are increasing and the indicator is decreasing, prices will typically correct to confirm the indicator.
Trading Signals of the Day
Bullish Reversal Triggers
Reversal bars are an objective technique used to time the entry of a trade. Read More...
http://daily-stocks.netfirms.com/daily-trading-triggers.htm
http://daily-stocks.netfirms.com/daily-trading-triggers.htm
Trading Ideas & Picks
DCI's fast stochastic rose above the slow stochastic in oversold territory today; we find this especially bullish in consideration of the fact that trading volume has recently been implying higher prices...
Trading Picks - Read More
NASDAQ Chart of the Day

Daily Trading Signals
ONNN has gotten a big upside gap from a tight consolidation, which is quite bullish. Watch for strength back toward resistance at 7.60.
Daily Trading Signals
Daily Market Commentary
Updated Thursday, 5/25 for Friday's market
Steady Uptrend
Read More...
Updated Thursday, 5/25 for Friday's market
| Key DOW Levels for 5/26 | |
| UP | Above 11,250 |
| DN | Below 11,025 |
Steady Uptrend
- Dow trends higher throughout session, tests 11,200.
- NASDAQ and S&P each pushed steadily higher throughout the session today and are now approaching key resistance. Watch these zones closely tomorrow for direction.
Summary
The Dow ended the day at the highs of the session after pushing steadily higher throughout the day. The index closed the day testing key resistance at 11,200, which indicates optimism in the market. Watch 11,250 for a break to indicate continued strength in the near-term. Otherwise, a break back below 11,150 will make for another cause for selling within the range.
Thursday, May 25, 2006
Daily Stock Picks
More... Stock Picks Page #1
Overreaction (Potential Bullish Bounce) - GEPT NSTR XMSR
(Stocks making a 52 WK low and moving down 10% or more in one day)
Slams - BCGI ESCL GEPT INTN QLTY REFR SNIC TWAV XMSR
(Stocks experiencing a significant drop in price (>10%). Playing Slams requires constant vigilance and quick response time)
Volume Pop - JAMS MANU FRGO MGPI UPCS
(Volume Pop With High ADX & RSI)
More... Stock Picks Page #1
Swing Trade of the Week
GPRO: Stock surged through a support area, then traded at the lower end of the bearish colored candle, representing a consolidation and possible setup for further downside...
Swing Trade Idea - Read More
Daily Market Commentary
Updated Wednesday, 5/24 for Thursday's market
Still Consolidating..
Read More...
Updated Wednesday, 5/24 for Thursday's market
| Key DOW Levels for 5/25 | |
| UP | Above 11,225 |
| DN | Below 11,025 |
Still Consolidating..
- Dow trades sideways within range, continues building toward a breakout.
- NASDAQ and S&P each put in new lows today and have now expanded their respective trading ranges. Look to these ranges for key direction.
Summary
The Dow closed today's volatile session with a mild gain and continues to hold firmly within the boundaries of the developing consolidation. This consolidation is clearly the pattern to watch for the next big medium term move. Watch 11,200 and 11,025 for early signs of a breakout move.
NASDAQ Chart of the Day
 DLTR is getting the initial break through support at 25.60. This break could spark a steady move down from this large trading range.
Daily Trading Signals
DLTR is getting the initial break through support at 25.60. This break could spark a steady move down from this large trading range.Daily Trading Signals
Wednesday, May 24, 2006
Trading Ideas & Picks
This short move to as low as $81 before lifting off its lows with the rest of the oil stocks on Friday. Volume was heavy as you can see on the chart which is good. See chart for more comments...
Trading Ideas - Read More
Trading Ideas & Picks
A Strong Breakout in a Bullish Market - After declining for more than three months, CHS began consolidating in a double bottom formation...
Trading Picks - Read More
Technical Indicators
Fibonacci Retracements
Read More...Fibonacci Retracements are displayed by first drawing a trendline between two extreme points, i.e. a trough and opposing peak. A series of horizontal lines are drawn intersecting the trendline at the Fibonacci levels.
After a significant price move in either up or down direction, prices will often give back a significant portion (if not all) of the original move. As prices retrace, look for support and resistance levels often occurring at or near the Fibonacci Retracement levels.
After a significant price move in either up or down direction, prices will often give back a significant portion (if not all) of the original move. As prices retrace, look for support and resistance levels often occurring at or near the Fibonacci Retracement levels.
NASDAQ Chart of the Day
Daily Trading Signals
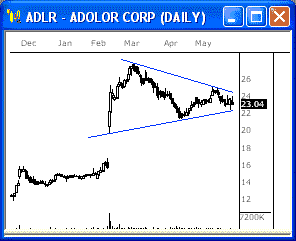
ADLR is winding up within a large triangle consolidation. A breakout from this triangle could be very big for the next move. Watch 22.25 down and 24.50 up for the breakout.
Daily Trading Signals
Daily Market Commentary
Updated Tuesday, 5/23 for Wednesday's market
in the Range..
Read More...
Updated Tuesday, 5/23 for Wednesday's market
| Key DOW Levels for 5/24 | |
| UP | Above 11,200 |
| DN | Below 11,025 |
in the Range..
- Dow holds at 11,200, stays within clear trading range.
- NASDAQ and S&P each pulled back from early highs today, but continue to build out within the boundaries of a potential continuation range. Watch this range closely for key direction ahead.
Summary
The Dow closed the day with a steady drop from intraday resistance at 11,200. The index continues to build out within the boundaries of the large consolidation from 11,040 to 11,200, which we will continue to watch for the big breakout. Watch this range closely.
Monday, May 22, 2006
Trading Ideas & Picks
EXP moved up strongly off of support on Friday, suggesting a possible reversal. The reversal seems especially likely to continue; in addition to the bullish price action, volume was very strong, there was a bullish Stochastics crossover in oversold territory, and money flow was very positive...
Trading Picks - Read More
Recent Picks / Trading Ideas
| Weekly Market Update May 22 How the market opens this week will show us the direction for the rest of the week. If we continue to break support levels, we will hang on to our shorts ... |
| Swing Trade of the Week May 19 NUE: Stock surged through a support area, traded at the lower end of the bearish candle, representing a consolidation and possible setup for further downside ... |
| Worst Stocks Scan May 19 A couple times a year, it is a good idea to scan and investigate those stocks that performed worst over the last 52 week; you occasionally get some good ideas ... |
| Double Top Formation May 18 STX completed a double top formation, but then rose above the pivot line. A secondary decline through the pivot line would result in a sharp drop ... |
| Weekly Market Recap May 15 The longer term trend is up.. we do note a warning sign with prices closing below the 20 day EMA shortly after making new multi-year highs. The short term trend is bearish ... |
| Swing Trade of the Week May 11 JCOM: Stock surged past resistance with a bullish candle, traded at the upper end of the bullish breakout candle, representing a consolidation and possible setup for further upside ... |
| BIDU - Super Earnings, Gapping Higher May 10 Super earnings tonight after the bell had this stock gapping up big in after hours trading ... |
| Stochastics Reversal May 4 EMMS - A real change in direction. Momentum has begun to grow with a couple of strongly positive days on unusually high volume ... |
| Monthly Market Recap May 1 The Macro weekly uptrend is still bullish. Market has once again found support. A breach of the support could signal an early change in the larger trend ... |
| Daily Market Commentary Winding Up.. - Dow trades back and forth at lows, winds up within clear triangle ... |
Technical Indicators
TRIX - Triple Exponential Moving Average
CThe Triple Exponential Moving Average (TRIX) is an oscillator used to identify oversold and overbought markets as well as a momentum indicator. For use as an oscillator look for a positive value to indicate an overbought market and a negative value indicate an oversold market. When TRIX is used as a momentum indicator, a positive value suggests increasing momentum just as a negative value suggests momentum is decreasing. Some believe that the TRIX crossing above the zero line is a buy signal and a closing below the zero line is a sell signal. Divergence between price and TRIX can also indicate significant turning points in the market...
Daily Market Commentary
Updated Friday, 5/19 for Monday's market
Winding Up..
Read More...
Updated Friday, 5/19 for Monday's market
| Key DOW Levels for 5/22 | |
| UP | Above 11,200 |
| DN | Below 11,070 |
Winding Up..
- Dow trades back and forth at lows, winds up within clear triangle.
- NASDAQ and S&P traded sideways for much of the session today and are now forming key triangle consolidations. Watch these patterns for key medium term direction.
Summary
The Dow closed the day within the boundaries of a coiling triangle consolidation. This triangle is the next pattern that will spark big movement in this index and possibly to the upside. Watch it closely.
NASDAQ Chart of the Day
Daily Trading Signals
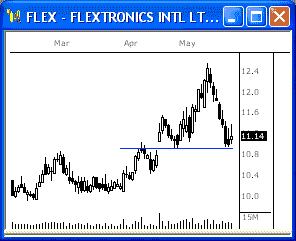
FLEX is holding at a clear support level at 10.90, which has held over the last month. A break or bounce of this zone should spark the next key move.
Daily Trading Signals
![]()