Friday, May 12, 2006
Trading Education Tutorial
Elliott Wave Theory
Read More...
Elliott Wave Theory
In the 1930s, Ralph Nelson Elliott found that the markets exhibited certain repeated patterns. His primary research was with stock market data for the Dow Jones Industrial Average. This research identified patterns or waves that recur in the markets. Very simply, in the direction of the trend, expect five waves. Any corrections against the trend are in three waves. Three wave corrections are lettered as "a, b, c." These patterns can be seen in long-term as well as in short-term charts. Ideally, smaller patterns can be identified within bigger patterns. In this sense, Elliott Waves are like a piece of broccoli, where the smaller piece, if broken off from the bigger piece, does, in fact, look like the big piece. This information (about smaller patterns fitting into bigger patterns), coupled with the Fibonacci relationships between the waves, offers the trader a level of anticipation and/or prediction when searching for and identifying trading opportunities with solid reward/risk ratios.
There have been many theories about the origin and the meaning of the patterns that Elliott discovered, including human behavior and harmony in nature. These rules, though, as applied to technical analysis of the markets (stocks, commodities, futures, etc.), can be very useful regardless of their meaning and origin...
There have been many theories about the origin and the meaning of the patterns that Elliott discovered, including human behavior and harmony in nature. These rules, though, as applied to technical analysis of the markets (stocks, commodities, futures, etc.), can be very useful regardless of their meaning and origin...
Read More...
Technical Indicators
Standard Error Bands
Standard Error Bands
Created by Jon Anderson, Standard Error Bands are two moving averages based on standard error levels above and below the Linear Regression Indicator. As a type of envelope, they are similar in appearance to Bollinger Bands but are calculated and interpreted quite differently. While Bollinger Bands are plotted at standard deviation levels above and below a moving average, Standard Error Bands are plotted at standard error levels above and below the linear regression plot.
Andersen recommends default values of "21" for the number of periods, a 3-day simple moving average for the smoothing, and "2" standard errors. He also notes that very short time frames tend to produce unreliable results.
Because the spacing between Standard Error Bands is based on the Standard Error of the security, when the two bands are close together, it signifies a strong trend. When the two bands are far apart, prices are more volatile and will tend to fluctuate between the two bands. If the bands are close and then begin to widen, it may signify that the trend is weakening and may possibly be due for a reversal...
Read More...Andersen recommends default values of "21" for the number of periods, a 3-day simple moving average for the smoothing, and "2" standard errors. He also notes that very short time frames tend to produce unreliable results.
Because the spacing between Standard Error Bands is based on the Standard Error of the security, when the two bands are close together, it signifies a strong trend. When the two bands are far apart, prices are more volatile and will tend to fluctuate between the two bands. If the bands are close and then begin to widen, it may signify that the trend is weakening and may possibly be due for a reversal...
Daily Market Commentary
Updated Thursday, 5/11 for Friday's market
Downside Break
Read More...
Updated Thursday, 5/11 for Friday's market
| Key DOW Levels for 5/12 | |
| UP | Above 11,675 |
| DN | Below 11,425 |
Downside Break
- Dow breaks key support.
- NASDAQ and S&Peach broke below key support levels and remain vulnerable to further weakness in the near term.
Summary
While today's decisive break of 11,550 indicates a bearish shift in bias, we should remain caution until there is a definitive break below 11,425. However, considering the magnitude of today's weakness, we are likely to see a brief period of consolidation and/or retracement as the index gears up for its next decisve advance or decline.
NASDAQ Chart of the Day

Daily Trading Signals

SPLS has established an upward sloping trend channel. Typically, this sort of upward sloping consolidation is bearish in nature. Look for a break below 25.8 to establish a short position. Conversely, a break 27.8 will mark a bullish resolution to the pattern.
Daily Trading Signals
Thursday, May 11, 2006
Swing Trade of the Week
JCOM: Stock surged past resistance with a bullish colored candle, traded at the upper end of the bullish breakout candle, representing a consolidation and possible setup for further upside....
Swing Trade Idea - Read More
Trading Ideas & Picks
SKYW had been stuck in a steady decline for over a month. Prior to Wednesday's breakout, the stock had fallen over 20%.The most important bullish markers for this likely reversal are the high volume during the breakout, and the bullish crossover of the stochastic indicators in oversold territory...
Trading Picks - Read More
Trading Ideas & Picks
Super earnings after the bell had this stock gapping up big in after hours trading. Please see the chart for my notes on this stock from over a month ago when the stock was at $55. Tonight its trading at $75...
Trading Ideas & Picks
Super earnings after the bell had this stock gapping up big in after hours trading. Please see the chart for my notes on this stock from over a month ago when the stock was at $55. Tonight its trading at $75...
NASDAQ Chart of the Day

Daily Trading Signals
ECIL got a big downside break from a triangle consolidation at 10.50. The break from this range could spark a steady decline in this stock.
Daily Trading Signals
Daily Market Commentary
Updated Wednesday, 5/10 for Thursday's market
Volatility Increasing
Updated Wednesday, 5/10 for Thursday's market
| Key DOW Levels for 5/11 | |
| UP | Above 11,700 |
| DN | Below 11,550 |
Volatility Increasing
- Dow trades quietly early in the day, but volatility picks up steam late in the session.
- NASDAQ and S&P each broke key ranges to the downside today, but it was the NASDAQ that held on to big losses. The S&P bounced from lows, but continues to look a bit vulnerable to another decline behind weakness from the NASDAQ.
Summary
The Dow closed the day in wild and volatile fashion today, but will likely continue to build out before the next key move. Strength above 11,550 should continue to be seen in the medium term if this level remains untouched. Watch 11,670 and 11,600 for early direction.
Read More...- NASDAQ and S&P each broke key ranges to the downside today, but it was the NASDAQ that held on to big losses. The S&P bounced from lows, but continues to look a bit vulnerable to another decline behind weakness from the NASDAQ.
Summary
The Dow closed the day in wild and volatile fashion today, but will likely continue to build out before the next key move. Strength above 11,550 should continue to be seen in the medium term if this level remains untouched. Watch 11,670 and 11,600 for early direction.
Recent Picks / Trading Ideas
| Swing Trade of the Week May 11 JCOM: Stock surged past resistance with a bullish colored candle, traded at the upper end of the bullish breakout candle, representing a consolidation and possible setup for further upside ... |
| BIDU - Super Earnings, Gapping Higher May 10 Super earnings tonight after the bell had this stock gapping up big in after hours trading ... |
| Breakout May 9 SOLD broke out from a period of consolidation on high volume, then stock began consolidating in a bull flag; it has not yet broken out of this intraday pattern ... |
| Weekly Market Update May 8 The market is ready for a correction, even a sideways correction. For the market to breakout into an up trend, for this correction to end, the market needs to break the 1750 ... |
| Swing Trade of the Week May 4 NVDA: Stock surged through to new highs with a bullish colored candle, then traded at the upper end of the candle, representing a consolidation and possible setup for further upside ... |
| Stochastics Reversal May 4 EMMS - A real change in direction. Momentum has begun to grow with a couple of strongly positive days on unusually high volume ... |
| AAPL - Next Solid Buy Point May 1 Next solid buy point is when it gets over the horizontal trendline in the chart at $72 ... |
| Weekly Market Recap May 1 The market is back at support again. If it breaks the 1700 support level, it could start a long term down trend. It looks ready to break again, but not enough momentum ... |
| Monthly Market Recap May 1 The Macro weekly uptrend is still bullish. Market has once again found support. A breach of the support could signal an early change in the larger trend ... |
Wednesday, May 10, 2006
Trading Ideas & Picks
XMSR has been relatively weak to the market for the past week or so, but yesterday the stock made a comeback. Shares trended higher throughout the majority of the trading session after opening to the downside. Will the stock continue to climb today? It definitely has some momentum...
Trading Ideas & Picks
The stock is touching the up trend line after successfully bouncing off the line to the upside 5 times prior to this touch. ATRS tends to drop down quickly, touch the line, then pop back up quickly. This time around, the stock touched the trend line, mover slightly higher, then reversed and touched the line again. The downside moves have occurred on slightly higher volume than usual which makes the trade a bit questionable...
Trading Picks - Read More
Daily Market Commentary
Updated Tuesday, 5/9 for Wednesday's market
Steady Continuation...
Updated Tuesday, 5/9 for Wednesday's market
| Key DOW Levels for 5/10 | |
| UP | Above 11,700 |
| DN | Below 11,550 |
Steady Continuation...
- Dow continues slow, steady advance, pushes to new highs yet again.
- While the Dow pushed steadily higher, the NASDAQ and S&P each held firmly within the boundaries of clear consolidations. Look for continued range movement within these ranges until a solid breakout is seen.
Summary
The Dow ended the day with another steady advance and continues to push toward all time highs for the index. The index continues to pull away from the major 11,425 resistance level and will likely continue to exude strength as long as it remains above 11,550.
Read More...
NASDAQ Chart of the Day
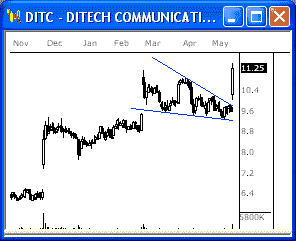
DITC got a big upside break from a bullish pennant today. This break is likely to spark another steady continuation over the next several weeks.
Daily Trading Signals
DITC got a big upside break from a bullish pennant today. This break is likely to spark another steady continuation over the next several weeks.
Daily Trading Signals
Tuesday, May 09, 2006
Trading Ideas & Picks
SOLD broke out from a period of consolidation on high volume, then stock began consolidating in a bull flag; it has not yet broken out of this intraday pattern. We would view a secondary breakout as very bullish...
Trading Picks - Read More
SOLD broke out from a period of consolidation on high volume, then stock began consolidating in a bull flag; it has not yet broken out of this intraday pattern. We would view a secondary breakout as very bullish...
Trading Picks - Read More
Trading Education Tutorial
REVERSAL BARS
Read More...
REVERSAL BARS
Reversal bars are an objective technique used to time the entry of a trade. When pattern, price and time all come together at a suspected major pivot, and you hesitate while wondering if the prior trend will continue against your new position, a reversal bar can be the objective trigger to prompt you to take action. The examples demonstrated below have many variations. The example given is not the only possible configuration for that reversal bar type. The important concept is that with every configuration, prices make a new high (or low) but close opposite the direction of the open and the trend. The reversal bar is telling you that the trend for that time frame has run out of gas and that no new buyers or sellers are coming into the market. For bullish reversals just substitute low for high.
Not every reversal bar is significant. This is especially true for intraday charts. Reversal bars take on importance when they occur at a coincidence of pattern, price and time...
Not every reversal bar is significant. This is especially true for intraday charts. Reversal bars take on importance when they occur at a coincidence of pattern, price and time...
Read More...
Technical Indicators
On Balance Volume (OBV)
On Balance Volume (OBV)
On Balance Volume (OBV) is a momentum indicator that relates volume to price change. Joseph Granville presented the idea that volume will precede price in his 1963 book, New Key to Stock Market Profits. On Balance Volume keeps a running total of volume flowing into or out of a security.
Look for rising trends (when each new peak is higher than the previous peak and each new trough is higher than the previous trough) or falling trends (when each successive peak is lower than the previous peak and each successive trough is lower than the previous trough) to signal a "breakout." OBV breakouts normally precede price breakouts and investors should buy long on OBV upside breakouts and sell short when on OBV downside breakouts. An OBV is moving sideways is in a doubtful trend and implies a hold until the trend changes...
Read More...Look for rising trends (when each new peak is higher than the previous peak and each new trough is higher than the previous trough) or falling trends (when each successive peak is lower than the previous peak and each successive trough is lower than the previous trough) to signal a "breakout." OBV breakouts normally precede price breakouts and investors should buy long on OBV upside breakouts and sell short when on OBV downside breakouts. An OBV is moving sideways is in a doubtful trend and implies a hold until the trend changes...
Daily Market Commentary
Updated Monday, 5/8 for Tuesday's market
Rally Above Resistance...
Read More...
Updated Monday, 5/8 for Tuesday's market
| Key DOW Levels for 5/9 | |
| UP | Above 11,625 |
| DN | Below 11,525 |
Rally Above Resistance...
- Dow trades sideways at highs, holds firmly above major resistance.
- NASDAQ tried to advance the market today, but wasn't able to muster any support. The NASDAQ and S&P each pulled back from highs and closed the day within a developing consolidation. Look for more of the same tomorrow.
Summary
The Dow closed the day about where it began today after traded quietly sideways throughout the session. We may see another day or two of range movement before the next key move is seen. Watch 11,625 and 11,525 for big movement.
Read More...
NASDAQ Chart of the Day

Daily Trading Signals
RSAS is forming a very tight triangle consolidation from 19.20 to 21.00. This tightly-wound pattern could lead to big movement. Watch for a solid breakout.
Daily Trading Signals
Monday, May 08, 2006
Trading Ideas & Picks
SIFY declined substantially and then consolidated in a small double bottom pattern. The stock broke out from its double bottom pattern on relatively high volume; the double bottom breakout was accompanied by a bullish Stochastics crossover in oversold territory...
Trading Picks - Read More
SIFY declined substantially and then consolidated in a small double bottom pattern. The stock broke out from its double bottom pattern on relatively high volume; the double bottom breakout was accompanied by a bullish Stochastics crossover in oversold territory...
Trading Picks - Read More
Daily Stock Picks
Oversold Stocks - CRYP ICOS IFOX IKAN ITMN POWI THOR TUES
(Stocks closing higher than they opened, crossing up through their 25 Stochastic level, and on 150%+ greater than average six-month volume)
Stochastic Possible Plays - BABY POWI PSYS
(Stochastic Cross Up above 20, but is lees than 35; Average Volume 6 Months is greater than 100k; Average Volume of 2 Days is greater than 150% of Average Volume for 6 Months)
Volume Pop - ATAR CHTR FCSE GMST NMSS SATC WAVX
(Volume Pop With High ADX & RSI)
More... Stock Picks Page #1
Technical Indicators
Linear Regression Slope
Linear Regression Slope is designed to show how much one should expect prices to change per unit of time.
As the Slope of a trend first becomes significantly positive, open a long position. Either sell or open a short position as the Slope becomes significantly negative..
Linear Regression Slope
Linear Regression Slope is designed to show how much one should expect prices to change per unit of time.
As the Slope of a trend first becomes significantly positive, open a long position. Either sell or open a short position as the Slope becomes significantly negative..
Daily Market Commentary
Updated Friday, 5/5 for Monday's market
Rally Above Resistance...
Read More...
Updated Friday, 5/5 for Monday's market
| Key DOW Levels for 5/8 | |
| UP | Above 11,600 |
| DN | Below 11,400 |
Rally Above Resistance...
- Dow breaks free from 11,425, rallies big for the session.
- NASDAQ lagged the broader market today, but tagged along for the rally due to the strength in the Dow. The S&P pushed to new highs after breaking key resistance. Look for continuation patterns to form to indicate continued strength.
Summary
The Dow broke away from major resistance via an upside break from the tight consolidation, which led to a huge triple-digit rally. The index is getting a solid break through major resistance and is fast approaching all-time highs. Look for a continuation pattern to form at the highs to indicate that continued overall strength is likely.
Read More...
NASDAQ Chart of the Day
 FEIC is back at critical resistance at 26.00. If this stock cannot rise above this zone, look for another big decline to occur.
Daily Trading Signals
FEIC is back at critical resistance at 26.00. If this stock cannot rise above this zone, look for another big decline to occur.Daily Trading Signals
![]()