Friday, September 01, 2006
Technical Indicators
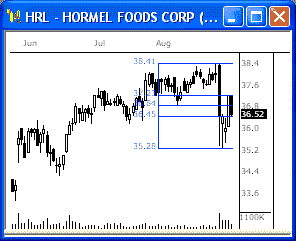
Standard Deviation Channel
Read More...The Standard Deviation Channel is two lines plotted parallel to the Linear Regression Trendline. These lines are distanced by n number of standard deviations above and below the LRT.
Over time, prices generally move from one extreme to another. As market participants become overly optimistic, prices are driven up at an unsustainable rate. Likewise, when market participants are overly pessimistic, prices move down at an unsustainable rate.
Given this, markets tend to have an equilibrium pricing point. While the Linear Regression Trendline can help determine where such a point lies, it is the Standard Deviation Channel that is helpful in determining where the extremes fall...
Trading Education Tutorial
Double Tops and Bottoms

Waiting for the Setup to Complete Results in Profits
Read More...
Double Tops and Bottoms
Waiting for the Setup to Complete Results in Profits
There are various chart patterns that help us find good reversal candidates. Of the major reversal patterns, the double top or bottom is not only one of the most recognizable, but also one of the most predictive.
Read More...
Daily Market Commentary
Updated Thursday, 8/31 for Friday's market
11,400 Holds...
Read More...
Updated Thursday, 8/31 for Friday's market
| Key DOW Levels for 9/1 | |
| UP | Above 11,425 |
| DN | Below 11,350 |
11,400 Holds...
- Dow continues to honor resistance at 11,400, sets up for big move away from this level. The index continues to honor this key resistance level, which could make for a much bigger move away from this level once direction is established.
- The NASDAQ and S&P each traded sideways throughout the session within the boundaries of clear consolidations. Watch these ranges for movement tomorrow.
Summary
The Dow ended the day with a minor loss today, but continues to be rejected by the 11,400 resistance level. Watch for a big break or reversal to occur from this level in the near term. Such a move could spark movement not seen in three weeks.
Read More...
Thursday, August 31, 2006
NASDAQ Chart of the Day

Daily Trading Signals
MIKR has broken a small triangle range to the upside and has a load of bullish momentum behind the breakout. Watch for much more strength ahead from this stock.
Daily Trading Signals
NYSE Chart of the Day

Daily Trading Signals
AXE is consolidating at the highs of the latest advance. A breakout from this consolidation is very likely to spark the next key move in this stock. Watch 57.75 up, and 54.00 down.
Daily Trading Signals
Daily Market Commentary
Updated Wednesday, 8/30 for Thursday's market
Holding at 11,400
Read More...
Updated Wednesday, 8/30 for Thursday's market
| Key DOW Levels for 8/31 | |
| UP | Above 11,425 |
| DN | Below 11,300 |
Holding at 11,400
- Dow rallies to 11,400, holds to the Close. The index closed with a gain of just 13 points and is now holding beneath the 11,400 level, which we will continue to watch.
- The NASDAQ and S&P each pushed to new highs today, but did so in a cautious manner. Look to resistance for a much bigger break or bounce tomorrow.
Summary
The Dow closed the day with a mild gain after testing the waters above 11,400. This is clearly the level to watch for major directional movement tomorrow. Watch for a break or bounce away from this zone for a tradable move.
Read More...
Trading Education Tutorial
Fibonacci Retracement Levels
Using Retracement Levels in Your Trading
Read More...
Fibonacci Retracement Levels
Using Retracement Levels in Your Trading
Leonardo Fibonacci da Pisa was a thirteenth century mathematician who (re) discovered what is today known as the Fibonacci sequence. Adding 1+1 and then continuing to add the sum to the previous number will arrive at this numerical sequence. The sequence gives rise to the following numbers: 1, 1, 2, 3, 5, 8, 13, 21, 34, 55 and so on.
Read More...
Trading Signals of the Day
Bullish Reversal Triggers

Reversal bars are an objective technique used to time the entry of a trade. Read More... http://daily-stocks.netfirms.com/daily-trading-triggers.htm
Wednesday, August 30, 2006
NASDAQ Chart of the Day

Daily Trading Signals
SAFM got a solid breakaway gap today on high volume, which is very bullish. Watch for continued overall strength from this stock ahead.
Daily Trading Signals
NYSE Chart of the Day

Daily Trading Signals
EME is winding up within the boundaries of a clear triangle range. A breakout from this range could spark another nice move in this stock. Watch 56.00 up, and 53.00 down.
Daily Trading Signals
Trading Education Tutorial
Measured and Exhaustion Gaps

Identifiable Patterns After Confirmation Move
Read More...
Measured and Exhaustion Gaps
Identifiable Patterns After Confirmation Move
We have previously mentioned the three types of gaps that are of relevance to investors - the breakaway gap, the measured (or continuation) gap, and the exhaustion gap. We previously discussed the breakaway gap, but it is important to discuss the measured gap and exhaustion gap at the same time. Why? Because it is difficult to tell one from the other until after the fact.
Read More...
Daily Market Commentary
Updated Tuesday, 8/29 for Wednesday's market
Late-Day Rally
Read More...
Updated Tuesday, 8/29 for Wednesday's market
| Key DOW Levels for 8/30 | |
| UP | Above 11,400 |
| DN | Below 11,300 |
Late-Day Rally
- Dow drops throughout session, but gets solid late-day rally back to key resistance. The index is now holding at resistance once again, which we will continue to watch for big movement.
- The NASDAQ and S&P each reversed sharply from the day's lows and powered solidly higher to the Close. Each is now testing key resistance, which could lead to big moves ahead.
Summary
The Dow ended the day back at key resistance after a solid afternoon rally. Watch this resistance level closely tomorrow, as a break or bounce could lead to another big move.
Read More...
Profit Taking
Read More...
Psychologist, Dr. Daniel Kahneman (The Nobel prize in economics - the field of behavioral economics) basically shows that investors are irrational, but predictably irrational. They continue to make the same mistakes over and over. One of the biggest is a common inability to take a loss: taking a loss is so painful, it is simply avoided.
A trader's most valuable commodity is trading capital. What is the most important rule for a trader? Preserve your capital. This is what keeps a trader in the game, and it is foolish to do anything that will jeopardize it. Subsequently, to preserve a trader's capital, there are rules that help a trader, whether in short, intermediate or long term play.
The rules listed below are suggestions. Only the trader can decide which rule is important. However, when a trader decides on a set of rules, they should be used consistently. Rules make up a trader’s system and are enforced by discipline.
Read More...
Tuesday, August 29, 2006
NASDAQ Chart of the Day
Daily Trading Signals
ANAD has gotten a solid upside break through a clear upper trend line via a breakaway gap on high volume, which is bullish. Watch for continued strength from this stock.
Daily Trading Signals
NASDAQ Chart of the Day
Daily Trading Signals
ANAD has gotten a solid upside break through a clear upper trend line via a breakaway gap on high volume, which is bullish. Watch for continued strength from this stock.
Daily Trading Signals
NASDAQ Chart of the Day
Daily Trading Signals
ANAD has gotten a solid upside break through a clear upper trend line via a breakaway gap on high volume, which is bullish. Watch for continued strength from this stock.
Daily Trading Signals
Trading Education Tutorial
Triangles

Tightening Price Action Leads to a Breakout
Read More...
Triangles
Tightening Price Action Leads to a Breakout
There are various forms of consolidation and they occur anytime there is an equilibrium of buyers and sellers. One of the most predictive consolidation formations is the triangle.
Read More...
NYSE Chart of the Day

Daily Trading Signals
SFD is holding precisely at resistance at 29.65, which has held in tact since April. Watch this zone for a break or reversal for the next key move.
Daily Trading Signals
Daily Market Commentary
Updated Monday, 8/28 for Tuesday's market
Rally to Resistance
Read More...
Updated Monday, 8/28 for Tuesday's market
| Key DOW Levels for 8/29 | |
| UP | Above 11,400 |
| DN | Below 11,250 |
Rally to Resistance
- Dow breaks upper trend line, rallies to resistance at 11,385. The index closed the day with a nice 68 point gain, but continues to be stumped by the 11,385 resistance level, which we will continue to watch closely.
- The NASDAQ and S&P each pushed to new highs today, but continue to struggle at near-term resistance. Watch today's late-day range for further directional clues tomorrow.
Summary
The Dow ended the day with a solid gain after breaking through a clear upper trend line. However, the major 11,385 resistance level held firmly once again. Watch this zone for continued overall strength; otherwise, continued range movement is likely between 11,250 and 11,385.
Read More...
Daily Stock Picks
Bottoming -
Aug 25 for Aug 28:
CECO CORT FINL METH MRCY
(Stocks making a 52 WK low but closing higher than they opened)
Oversold Stocks -
Aug 25 for Aug 28:
HYGS
(Stocks closing higher than they opened, crossing up through their 25 Stochastic level, and on 150% + greater than average 6 month volume)
Overreaction -
Aug 25 for Aug 28:
CORT ISLE
(Potential Bullish Bounce: Stocks making a 52 WK low and moving down 10% or more in one day)
More... Stock Picks Page #1
Trading Education Tutorial
Volatility

Well Behaved Stocks Reap Rewards
Read More...
Volatility
Well Behaved Stocks Reap Rewards
Some stocks move multiple points and multiple directions in one trading session. Other stocks are more methodical in their day-to-day movement. Which type of stock is more attractive to you as an investor?
Read More...
NYSE Chart of the Day

Daily Trading Signals
Aug 28th: GG is winding up within the boundaries of a large triangle range that has formed after a severe decline in May. A breakout from this range will likely spark the next key directional move in this stock. Watch 31.75 up, and 28.00 down.
Daily Trading Signals
Monday, August 28, 2006
NASDAQ Chart of the Day

Daily Trading Signals
FRED has pulled back to 62% Retracement after dropping from May to July. The stock is now beginning to fizzle out at 62% and could drop to new lows soon. Watch 12.50 for continued weakness.
Daily Trading Signals
Daily Market Commentary
Updated Friday, 8/25 for Monday's market
Still Hollding...
Read More...
Updated Friday, 8/25 for Monday's market
| Key DOW Levels for 8/28 | |
| UP | Above 11,325 |
| DN | Below 11,250 |
Still Hollding...
- Dow strades sideways yet again, holds within tight range around 11,300 level. The index closed the day quietly with a 20 point loss, but should get more movement next week.
- The NASDAQ and S&P each continue to trade slowly and steadily sideways. Look for a confirmed breakout opportunity for direction Monday.
Summary
The Dow closed the day quietly today, and continues to hold within the boundaries of a tight range just above key support at 11,250. If the Dow can remain above 11,250, the index will have a solid shot at continued overall strength. Otherwise, a break through support could spark big selling.
Read More...
Trading Ideas & Picks
Trading Ideas - Read More
On a long term basis: 1. The market changed the trend into an up trend. 2. We made a double bottom, came up with lots of momentum. 3. Expect this up trend to last 4-6 months 4. Market is pulling back now to confirm the change of trend On a shorter term basis: 1. The first wave of the up trend needs to be confirmed 2. The market needs to pull back and test the breakout levels. 3. It has been a nasty week so far, completely lacking for volume and momentum...
Trading Ideas - Read More
Trading Ideas & Picks
Trading Picks - Read More
QQQQ: It looks like the QQQQ may test the support at the bottom of the gap (illustrated by the dotted lines) near $37.75. We'll continue to watch the 100 DMA because this moving average is the next major resistance that is preventing the long-term downtrend from continuing...
![]()