Friday, October 06, 2006
Trading Signals of the Day
Bullish Reversal Triggers

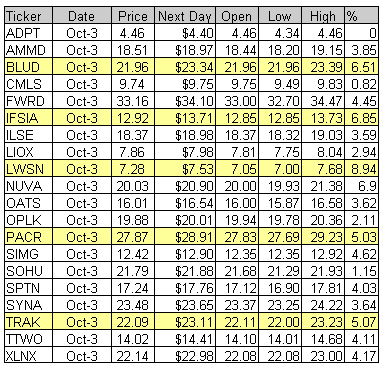
Reversal bars are an objective technique used to time the entry of a trade. Read More... http://daily-stocks.netfirms.com/daily-trading-triggers.htm
Technical Indicators
Stochastic Oscillator
The Stochastic Oscillator compares the closing price of a security to its price range over a given time period. Its displayed by two lines, a main line called %K (drawn in solid blue) and a secondary line (in dotted green) called %D. The %D line is the moving average of the %K.
The Stochastic Oscillator contains four variables:
· %K Periods:
This is the number of time periods used in the stochastic calculation.
· %K Slowing Periods:
This value controls the internal smoothing of %K. A value of 1 is considered a fast stochastic while a value of 3 is considered a slow stochastic.
· %D Periods:
This is the number of time periods used when calculating the moving average of %K.
· %D Method:
The method (Exponential, Simple, Time Series, Triangular, Variable, or Weighted) used to calculate %D
When trading using the Stochastic Oscillator, one method is to buy when either %K or %D falls below 20 and then rises back above that level. Similarlily, sell when the either line rises above 80 and then falls back below. Another pattern to look for when timing trades is buy when the %K line rises above the %D line or sell when the %K line falls below the %D line. Lastly, one should always be on the lookout for diveregnces. For example, if prices are making a series of new highs and the Stochastic Oscillator fails to surpass its previous highs, the indicator typically will provide the clue as to where prices will soon head...
Read More...The Stochastic Oscillator compares the closing price of a security to its price range over a given time period. Its displayed by two lines, a main line called %K (drawn in solid blue) and a secondary line (in dotted green) called %D. The %D line is the moving average of the %K.
The Stochastic Oscillator contains four variables:
· %K Periods:
This is the number of time periods used in the stochastic calculation.
· %K Slowing Periods:
This value controls the internal smoothing of %K. A value of 1 is considered a fast stochastic while a value of 3 is considered a slow stochastic.
· %D Periods:
This is the number of time periods used when calculating the moving average of %K.
· %D Method:
The method (Exponential, Simple, Time Series, Triangular, Variable, or Weighted) used to calculate %D
When trading using the Stochastic Oscillator, one method is to buy when either %K or %D falls below 20 and then rises back above that level. Similarlily, sell when the either line rises above 80 and then falls back below. Another pattern to look for when timing trades is buy when the %K line rises above the %D line or sell when the %K line falls below the %D line. Lastly, one should always be on the lookout for diveregnces. For example, if prices are making a series of new highs and the Stochastic Oscillator fails to surpass its previous highs, the indicator typically will provide the clue as to where prices will soon head...
Trading Tools
Shogun Swing Trading - Best Swing Trading:
Shogun Trading's approach can benefit all stock traders, from day traders to long term swing traders. We are proud to show some of the best Performance in Day Trading, Longer Term Swing Trading Strategy, Systemized Swing Trading and through our Educational Courses and Videos... » Get More Info Now!
Shogun Trading's approach can benefit all stock traders, from day traders to long term swing traders. We are proud to show some of the best Performance in Day Trading, Longer Term Swing Trading Strategy, Systemized Swing Trading and through our Educational Courses and Videos... » Get More Info Now!
NASDAQ Chart of the Day

Daily Trading Signals

NUAN is breaking out a very clear triangle range at 8.40, which is highly bullish. Watch for a solid continuation higher toward the 11.00 range.
Daily Trading Signals
NYSE Chart of the Day

Daily Trading Signals

FLE is getting a huge upside break from a very tight consolidation at 7.40, which could spark much more strength ahead. Watch for movement back toward the 10.00 zone.
Daily Trading Signals
Trading Education Tutorial
Breakaway Gaps

Pressure Helps Identify Movers
Read More...
Breakaway Gaps

Pressure Helps Identify Movers
Gaps occur when there is a dramatic change in market conditions. They can occur at the beginning of a trading session (i.e. most NASDAQ stocks) or even during the session itself. There are three types of gaps that are of interest to us when we analyze charts: breakaway, measured (also known as continuation) and exhaustion gaps. Today we will discuss the breakaway gap...
Read More...
Daily Market Commentary
Updated Thursday, 10/5 for Friday's market
Holding...
Read More...
Updated Thursday, 10/5 for Friday's market
| Key DOW Levels for 10/6 | |
| UP | Above 11,900 |
| DN | Below 11,800 |
Holding...
- Dow holds throughout the session, maintains the week's big gains. The index continues to set successive all-time closing highs, but continues to look over-extended in the near term.
- The NASDAQ and S&P each continue to push higher within the current uptrend, but may be over-extended in the near-term. Look for a period of consolidation to occur at the highs before another key move is seen.
Summary
The Dow closed the day with another gain to extend the all-time closing highs for the third straight session. The index looks to be in a holding pattern at this point, however, as it looks to regain its momentum. Watch the 11,800 level as the next key fulcrum for medium term direction.
Read More...
Thursday, October 05, 2006
NYSE Chart of the Day
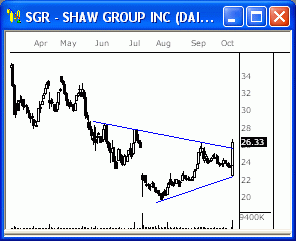
SGR is getting a huge upside break from a large triangle consolidation at 25.75, which is highly bullish. Look for this stock to continue solidly higher, likely back toward the 36.00 range.
Daily Trading Signals

SGR is getting a huge upside break from a large triangle consolidation at 25.75, which is highly bullish. Look for this stock to continue solidly higher, likely back toward the 36.00 range.
Daily Trading Signals
NASDAQ Chart of the Day

Daily Trading Signals

EBAY has broken a large consolidation to the upside at 29.00, which is quite bullish. Look for continued overall strength out of this pattern toward the May highs.
Daily Trading Signals
Trading Ideas & Picks
Trading Ideas - Read More
CREE: SStock broke through a resistance area and has since traded at the upper end of the bullish breakout candle, representing a consolidation and possible setup for further upside. Look to go long at 20.94...
Trading Ideas & Picks
Trading Picks - Read More
NEM: Stock created a new 52-week low and was pushed below an important level of support. As you can see from the chart below, the bears were able to push the price of NEM below a six-year trendline...
Trading Education Tutorial
Saucer Patterns

Rare Pattern Is One of the Most Predictive
Read More...
Saucer Patterns

Rare Pattern Is One of the Most Predictive
One of the most predicitive chart patterns you will come across is the saucer pattern. Saucers are also referred to as "bowls" or even "rounded tops or bottoms", and one look at this pattern tells where these names are derived from. However, there is a problem with saucer patterns - they're hard to find.
Read More...
Updated Wednesday, 10/4 for Thursday's market
| Key DOW Levels for 10/5 | |
| UP | Above 11,900 |
| DN | Below 11,700 |
Big Continuation
- Dow breaks through 11,750, races out to big gains. The index got a big upside break through 11,750 and rallied to a huge 123 point gain to shatter the prior day's all-time intraday and closing highs.
- The NASDAQ and S&P each rallied sharply from early lows this morning, sparking huge gains to the Close. Look for continuation patterns to form at the highs ahead of the next key move.
Summary
The Dow pushed steadily higher throughout the session today and flew through 11,800 en route to a huge day. Look for the index to either pull-back or consolidate at the highs while it regains its energy for the next move.
Read More...
Wednesday, October 04, 2006
Technical Indicators
Momentum
Read More...By measuring the amount that a security's price has changed over a given time span, the Momentum indicator provides an indication of a market's velocity and to some degree, a measure of the extent to which a trend still holds true. It can also be helpful in spotting likely reversal points.
While the mathematics are straightforward (subtract the closing price n days ago from the closing price today), do not underrate its value because of its simplicity.
Use the Momentum indicator as a trend-following oscillator similar to the MACD and buy when the indicator bottoms and turns up. Sell when the indicator peaks and turns down. When the Momentum indicator reaches extremely high or low values (relative to historical values) assume a continuation of the current trend...
Labels: TA Glossary
NASDAQ Chart of the Day
Daily Trading Signals

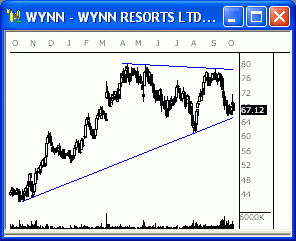
WYNN is approaching a major lower trend line at 65.00, which has remained in tact since last October. A downside break through this line could be huge for bears. Watch this zone closely.
Daily Trading Signals
NYSE Chart of the Day
Daily Trading Signals

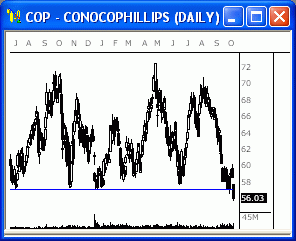
COP has gotten a huge downside break through major support at 57.00 via a breakaway gap. This support level had previously remained in tact since June of 2005, so a downside break here is huge. Watch for big weakness to follow.
Daily Trading Signals
Trading Education Tutorial
Double Tops and Bottoms

Waiting for the Setup to Complete Results in Profits
Read More...
Double Tops and Bottoms

Waiting for the Setup to Complete Results in Profits
There are various chart patterns that help us find good reversal candidates. Of the major reversal patterns, the double top or bottom is not only one of the most recognizable, but also one of the most predictive.
Read More...
Daily Market Commentary
Updated Tuesday, 10/3 for Wednesday's market
Record Close
Read More...
Updated Tuesday, 10/3 for Wednesday's market
| Key DOW Levels for 10/4 | |
| UP | Above 11,775 |
| DN | Below 11,650 |
Record Close
- Dow Dow hits all-time highs, remains beneath key 11,750 zone. The index pierced through 11,750 to set an all-time intraday high and eventually closed at 11,727.34, which is also a record for the Dow.
- The NASDAQ and S&P each pulled back from early lows to follow the Dow's lead today. However, each of these indexes continues to look weak compared to the Dow, which could pull the broader market down.
Summary
The Dow finally set all-time intraday and closing highs today, but could be on the verge of a retracement. Continued overall strength should be seen above 11,650, but a breach of this zone could spark big selling ahead.
Read More...
Tuesday, October 03, 2006
NASDAQ Chart of the Day

Daily Trading Signals

RBAK has formed a clear, bearish pennant consolidation at the lows of the latest decline, which also happens to be the right shoulder of a bearish head-and-shoulders pattern. A downside break through 13.50 could make for big weakness ahead.
Daily Trading Signals
NYSE Chart of the Day

ACL has gotten a big downside break through the bottom of an odd triangle consolidation, which is quite better. Watch for continued weakness from this stock.
Daily Trading Signals

ACL has gotten a big downside break through the bottom of an odd triangle consolidation, which is quite better. Watch for continued weakness from this stock.
Daily Trading Signals
Trading Education Tutorial
Measured and Exhaustion Gaps

Identifiable Patterns After Confirmation Move
Read More...
Measured and Exhaustion Gaps

Identifiable Patterns After Confirmation Move
We have previously mentioned the three types of gaps that are of relevance to investors - the breakaway gap, the measured (or continuation) gap, and the exhaustion gap. We previously discussed the breakaway gap, but it is important to discuss the measured gap and exhaustion gap at the same time. Why? Because it is difficult to tell one from the other until after the fact...
Read More...
Trading Ideas & Picks
Trading Picks - Read More
S&P 500 Forecasting Video Online Now - Get It for FREE!
SPX: SA mere glance at the latest averages reveals a stock market rife with divergences. History shows that narrow leadership or the failure of important averages to confirm can pose a grave threat to the stock market...
S&P 500 Forecasting Video Online Now - Get It for FREE!
Trading Ideas & Picks
Trading Ideas - Read More
The down trend that started back in May and has taken us all the way from 1677 to 1446 is almost undone now. Friday's high was 1666, which is only 11 points away. It is very rare that the market gives back a whole trend like this in one shot. Most trends bounce back 38%, 50% or 62%, but very rarely do they bounce 100%. I would say that the market will break out of this channel to the down side for some profit taking. We actually completed a double top on Friday, which shows short term weakness...
Trading Ideas - Read More
Trading Ideas & Picks
Trading Picks - Read More
QQQQ: The five consecutive closes above the 200-day moving average that we've seen over the past trading week suggest that the bulls are in the process of changing the direction of the QQQQ's long-term trend...
Daily Market Commentary
Updated Monday, 10/2 for Tuesday's market
In the Range...
Read More...
Updated Monday, 10/2 for Tuesday's market
| Key DOW Levels for 10/3 | |
| UP | Above 11,750 |
| DN | Below 11,650 |
In the Range...
- Dow remains within clear consolidation range, watch the boundaries tomorrow. The index sold off late in the day, but halted its decline right at the lower boundary of the clear consolidation that continues to form at the highs. Watch this range for big movement ahead.
- The NASDAQ and S&P each got big downside breaks from their respective consolidations, which is quite bearish. If the indexes hold beneath near-term support, more selling could be ahead.
Summary
The Dow continues to wind up within the clear consolidation range. Look for more range movement ahead of the big breakout. A breakout should finally yield big movement.
Read More...
Monday, October 02, 2006
Technical Indicators
Ease of Movement
The Ease of Movement Indicator was designed to illustrate the relationship between volume and price change. It shows how much volume is required to move prices.
High Ease of Movement values occur when prices are moving upward with light volume. Low values occur when prices are moving downward on light volume. If prices are not moving or if heavy volume is required to move prices then the indicator will read near zero.
A buy signal is produced when it crosses above zero (an indication that prices are more easily moving upward ). A sell signal is produced when the indicator crosses below zero (prices are moving downward more easily).
Read More...The Ease of Movement Indicator was designed to illustrate the relationship between volume and price change. It shows how much volume is required to move prices.
High Ease of Movement values occur when prices are moving upward with light volume. Low values occur when prices are moving downward on light volume. If prices are not moving or if heavy volume is required to move prices then the indicator will read near zero.
A buy signal is produced when it crosses above zero (an indication that prices are more easily moving upward ). A sell signal is produced when the indicator crosses below zero (prices are moving downward more easily).
NASDAQ Chart of the Day

Daily Trading Signals

INTC is holding at key resistance at 21.00, which has held in tact since March. Watch this zone for a key break or bounce for big medium term movement.
Daily Trading Signals
NYSE Chart of the Day
Daily Trading Signals

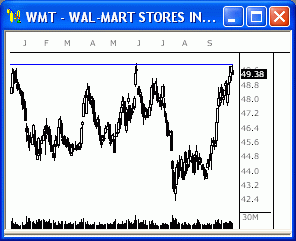
WMT looks to be topping out at the highs of the year at key resistance at 50.00. If this stock cannot rise above this zone, we could see a big decline from this level.
Daily Trading Signals
Trading Education Tutorial
Volatility

Well Behaved Stocks Reap Rewards
Read More...
Volatility

Well Behaved Stocks Reap Rewards
Some stocks move multiple points and multiple directions in one trading session. Other stocks are more methodical in their day-to-day movement. Which type of stock is more attractive to you as an investor...
Read More...
Daily Market Commentary
Updated Friday, 9/29 for Monday's market
Still Holding...
Read More...
Updated Friday, 9/29 for Monday's market
| Key DOW Levels for 10/2 | |
| UP | Above 11,750 |
| DN | Below 11,650 |
Still Holding...
- Dow continues pursuit of all-time highs, remains within consolidation. The index also failed to Close above the all-time closing highs, as a late-day reversal stopped that feat, seen in the 15 Minute Chart. The index eventually closed the day with a moderate loss, but continues to gear up within the boundaries of a clear consolidation, which we will continue to watch.
- The NASDAQ and S&P continue to hold within their respective ranges, which could make for big movement once a breakout occurs.
Summary
The Dow closed the day with a loss after attempting to break the all-time highs record yet again. Look for a breakout from the current three-day consolidation for movement Monday.
Read More...
Sunday, October 01, 2006
Quantum Swing Trader
Limited Offer
Quantum Swing Trader - Limited Edition
If you had a stock trading method that let you discover when a stock was about to make a massive move UP or DOWN, and then showed you, step-by-step, how to take advantage of that move to potentially pull profits out of the markets... would you be interested?
The "sweet spot" of Quantum Swing Trader is that it shows you how to take just a few common indicators, but use them in an uncommon way to "pinpoint" the spot in any stock where it has a high probability of making a massive move UP or DOWN, but not stay the same.
* Quantum Swing Trader - Limited Edition*
Bill's only releasing 1,000 more copies to the trading community, and only fot a limited time. He's doing this so he can make sure he can provide support and focus to his next group of students for his new course.
* Quantum Swing Trader - Limited Edition*
This course is HUGE. Here are some of the highlights:
** "Free Trade" strategy which is the goal of every trade he teaches you to place. This lets you get into a position and lock in some early profits.
** How to quickly scan over 8,000 stocks every night in seconds with Bill's search criteria to find the stocks that have a high- probability of entering into a potentially profitable position.
** Profit Feeder service, which "spoon feeds" you his highest-probability stocks every night.
** The 2 "cheat sheet" blueprints that summarize the entire method in one place so you don't need to spend hours hunting through the materials after you've studied it to find what you want.
** Spend no more than 20 minutes a night applying the method.
There's a ton more, including a dedicated section just for beginners, lifetime customer support, and some really unique bonuses, but you'll need to check out QST's web page to see everything for yourself:
Quantum Swing Trader - Limited Edition
Trading Education Tutorial
Trading Ranges

Big Moves Occur Outside of the Range
Read More...
Trading Ranges

Big Moves Occur Outside of the Range
A trading range is basically a horizontal channel in which a security moves from the high and low of the channel for an extended amount of time. Obviously, the upper level of the range can be considered resistance and the lower level represents support. Trading within a range is possible, but it's the breakout from the range that provides the best opportunities.
Read More...
NASDAQ Chart of the Day

Daily Trading Signals

ENER is beginning to break out of a large triangle pattern that could spark big movement. The breakout is occurring through 38.15 on high volume, which is quite bullish.
Daily Trading Signals
NYSE Chart of the Day
Daily Trading Signals

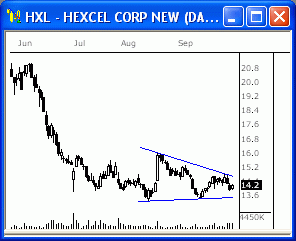
HXL is winding up within a clear consolidation, which could pack a punch once a breakout is seen. Watch 14.80 up, and 13.40 down.
Daily Trading Signals
Daily Market Commentary
Updated Thursday, 9/28 for Friday's market
Still Consolidating...
Read More...
Updated Thursday, 9/28 for Friday's market
| Key DOW Levels for 9/29 | |
| UP | Above 11,750 |
| DN | Below 11,650 |
Still Consolidating...
- Dow trades sideways throughout session, forms clear consolidation. The index closed the day with a 29 point gain for the session, but closed just 10 points below the all-time closing highs.
- The NASDAQ and S&P continue to wind up within their respective consolidations. However, the NASDAQ continues to be a bit more reserved than the broader market, which is concerning to big medium term strength.
Summary
The Dow ended the day with a modest gain and is now holding at the top of the clear consolidation that has formed at the overall highs. Look for further range movement ahead of the next key breakout.
Read More...