Saturday, June 10, 2006
Trading Ideas & Picks
The stock to be trading at an unjustified discount to peers and likely a result of differences in liquidity and coverage. VLGEA's long-term revenue and earnings growth has been modest. During the past five years, revenues have grown at an average annual rate of 4.08%; earnings have grown at an average annual rate of 9.92%.
A positive about long-term results has been consistency, irrespective of the conditions of the broader marketplace. An additional positive is the fact that VLGEA's results have outperformed those of other companies in the industry (who have negative revenue and profit growth, on average).
Volume has been following VLGEA positively. However, this is a relatively weak signal by itself, only slightly bullish on VLGEA from a technical standpoint...
Trading Picks - Read MoreA positive about long-term results has been consistency, irrespective of the conditions of the broader marketplace. An additional positive is the fact that VLGEA's results have outperformed those of other companies in the industry (who have negative revenue and profit growth, on average).
Volume has been following VLGEA positively. However, this is a relatively weak signal by itself, only slightly bullish on VLGEA from a technical standpoint...
Friday, June 09, 2006
Daily Market Commentary
Updated Thursday, 6/8 for Friday's market
Huge Reversal
Updated Thursday, 6/8 for Friday's market
| Key DOW Levels for 6/9 | |
| UP | Above 11,000 |
| DN | Below 10,750 |
Huge Reversal
- Dow v-bottoms and rallies over 200 points from intraday lows.
- The S&P and NASDAQ each got big bounces from intraday lows today and could be gearing up for even more strength. A huge reversal like today's can be highly indicative of further strength ahead.
Summary
The Dow closed the day with a huge 200 point rally from the day's lows today and actually closed the day with a gain. The index could be oversold in the medium term and we could be looking for a larger bounce. Watch the upper trend line at 10,975 for early signs of strength tomorrow; otherwise, a break below 10,850 will usher in more selling.
Read More...- The S&P and NASDAQ each got big bounces from intraday lows today and could be gearing up for even more strength. A huge reversal like today's can be highly indicative of further strength ahead.
Summary
The Dow closed the day with a huge 200 point rally from the day's lows today and actually closed the day with a gain. The index could be oversold in the medium term and we could be looking for a larger bounce. Watch the upper trend line at 10,975 for early signs of strength tomorrow; otherwise, a break below 10,850 will usher in more selling.
NASDAQ Chart of the Day
Daily Trading Signals
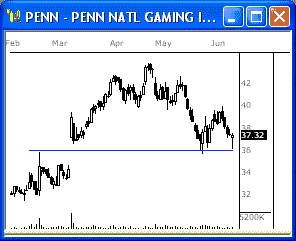
PENN is holding at a firm gap support level at 36.00, which has held since March. Look for a nice bounce in this zone.
Daily Trading Signals
Trading Ideas & Picks
HSYL: Stock surged through a support area with a bearish candle, then traded at the lower end, representing a consolidation and possible setup for further downside. Look to go short at 28.07....
Trading Ideas - Read More
The Lowdown on Bottoms
Bottoms print as a result of market physics. Uptrends and downtrends exhibit natural wave motion as they thrust forward, and they pull back to test gains or losses. This action-reaction becomes very important at market turning points. It implies that a reversal pattern will appear at some point in each trend. In an uptrend, a lower high will eventually follow a higher high and mark a new top. In a downtrend, lower lows will finally stop when price action prints a higher low. This marks the birth of a bottom. Read More...
Bottoms print as a result of market physics. Uptrends and downtrends exhibit natural wave motion as they thrust forward, and they pull back to test gains or losses. This action-reaction becomes very important at market turning points. It implies that a reversal pattern will appear at some point in each trend. In an uptrend, a lower high will eventually follow a higher high and mark a new top. In a downtrend, lower lows will finally stop when price action prints a higher low. This marks the birth of a bottom. Read More...
NASDAQ Chart of the Day

Daily Trading Signals
DPTR has sold off from the key 38% Retracement zone after falling steadily from the April highs. A downside break through 15.85 will likely spark another steady decline in this stock.
Daily Trading Signals
Daily Market Commentary
Updated Wednesday, 6/7 for Thursday's market
Reversal from Highs
Read More...
Updated Wednesday, 6/7 for Thursday's market
| Key DOW Levels for 6/8 | |
| UP | Above 11,100 |
| DN | Below 10,900 |
Reversal from Highs
- Dow gets steady afternoon sell-off, closes at prior lows.
- The S&P and NASDAQ each had failed rallies today, which does not offer optimism for tomorrow's market. Watch yesterday's lows for early signs of another decline.
Summary
Dow closed the day with another steep decline after first beginning the session with a nice wave of strength. The index continues to honor the neck line of the large head-and-shoulders pattern, which is the overriding pattern in this zone. Continued weakness is very likely as long as the pattern remains in tact.
Wednesday, June 07, 2006
Technical Indicators
True Strength Index
Read More...The True Strength Index (TSI) is a momentum-based indicator, developed by William Blau. Designed to determine both trend and overbought/oversold conditions, the TSI is applicable to intraday time frames as well as long term trading.
The True Strength Index is a variation of the Relative Strength indicator. It uses a double smoothed exponential moving average of price momentum to minimize choppy price changes and highlight spot trend changes with little or no time lag. An increasing True Strength value indicates increasing momentum in the direction of the price movement.
The True Strength Index is a variation of the Relative Strength indicator. It uses a double smoothed exponential moving average of price momentum to minimize choppy price changes and highlight spot trend changes with little or no time lag. An increasing True Strength value indicates increasing momentum in the direction of the price movement.
Daily Market Commentary
Updated Tuesday, 6/6 for Wednesd's market
Range Forming
Read More...
Updated Tuesday, 6/6 for Wednesd's market
| Key DOW Levels for 6/7 | |
| UP | Above 11,200 |
| DN | Below 10,900 |
Range Forming
- Dow pushes lower, forms consolidation at lows.
- The S&P and NASDAQ each closed the day lower, but rose nicely from the lows of the session to recoup much of the day's losses. The indexes are currently building out at the lows within the boundaries of clear consolidations, which we will watch for movement.
Summary
Dow closed the day with another decline and is now building out a potential consolidation at the lows. Look for the index to build out at the lows ahead of the next key decline. Watch 10,900 closely.
NASDAQ Chart of the Day

Daily Trading Signals
ADLR continues to wind up within the boundaries of a very tightly-coiled triangle consolidation, which has formed at the highs of a steady uptrend. Watch this range for a breakout for key movement.
Daily Trading Signals
Tuesday, June 06, 2006
Recent Picks / Trading Ideas
| Swing Trade of the Week June 1 NVDA: Stock surged through a support area then traded at the lower end of the bearish candle, representing a consolidation and possible setup for further downside ... |
| Weekly Market Update May 30 The market may bounce here...but this is not an up trend, it is a bounce against the major trend. This increases the risk of the long side trades and decreases their profit potential ... |
| Swing Trade of the Week May 11 GPRO: Stock surged through a support area, then traded at the lower end of the bearish candle, representing a consolidation and possible setup for further downside ... |
| Worst Stocks Scan May 19 A couple times a year, it is a good idea to scan and investigate those stocks that performed worst over the last 52 week; you occasionally get some good ideas ... |
| Double Top Formation May 18 STX completed a double top formation, but then rose above the pivot line. We believe that a secondary decline through the pivot line would result in a sharp drop ... |
| Weekly Market Recap May 15 The longer term trend is up.. we do note a warning sign with prices closing below the 20 day EMA shortly after making new multi-year highs. The short term trend is bearish ... |
Technical Indicators
Average Directional Movement Index Rating
Read More...The Average Directional Movement Index Rating (ADXR) is an attempt to quantify momentum change in the ADX. It is calculated by adding the current ADX value and an ADX value n periods back then dividing that sum by two.
This smoothing step results in the ADXR being slightly less responsive than the ADX. Where the ADXR shines is its ability to compensate for the variance of excessive tops and bottoms. It is especially helpful when used in conjunction with trend-following strategies. Strategies that rely on volatility as an indication of movement often fail to take into account movement does not necessarily indicate volatility. ADXR provides information pertaining to the strength of a trend, helping to manage the risk of trading in volatile markets that fluctuate between trending and non-trending. The interpretation of ADXR is the same as that for ADX, the higher the value, the stronger the trend
This smoothing step results in the ADXR being slightly less responsive than the ADX. Where the ADXR shines is its ability to compensate for the variance of excessive tops and bottoms. It is especially helpful when used in conjunction with trend-following strategies. Strategies that rely on volatility as an indication of movement often fail to take into account movement does not necessarily indicate volatility. ADXR provides information pertaining to the strength of a trend, helping to manage the risk of trading in volatile markets that fluctuate between trending and non-trending. The interpretation of ADXR is the same as that for ADX, the higher the value, the stronger the trend
NASDAQ Chart of the Day

Daily Trading Signals
ZION is trading in downward sloping trend channel. Focus on the boundaries on the channel for a decisive break to indicate future bias. Strength above 83 will likely trigger a rally back toward recent highs near 85.2. Conversely, weakness below 78.8 could trigger a capitulation toward 77.4.
Daily Trading Signals
Daily Market Commentary
Updated Monday, 6/5 for Tuesday's market
Late-Session Decline
Read More...
Updated Monday, 6/5 for Tuesday's market
| Key DOW Levels for 6/6 | |
| UP | Above 11,300 |
| DN | Below 11,000 |
Late-Session Decline
- The Dow capitulates back toward long-term support level.
- The S&P and NASDAQ both broke below the lower boundaries of upper sloping consolidation patterns. As these violations have clear bearish implication, we will look for continued weakness in the near-term.
Summary
For Tuesday’s session, we will focus on the manner in which the Dow interacts with the 11,040 support level. A solid break above or below this key support level will likely provided a early indication of intraday bias. However, considering the magnitude of today’ decline, a period of upward retracement and/or consolidation would not be unexpected.
Monday, June 05, 2006
Trading Ideas & Picks
After announcing weak earnings, TSU closed down for fourteen consecutive days (we have noted many times that there is often momentum following surprising earnings announcements); the stock fell over 40% over this period. However, recent trading has been very positive...
Trading Picks - Read More
Daily Stock Picks
Bottoming - BTRX MEMY WIND ZOMXI
(Stocks making a 52 WK low but closing higher than they opened)
Volume Pop - GTCB JAMS PPHM SVVS SKIL
(Volume Pop With High ADX & RSI)
Oversold Stocks - BTRX DRTE
(Stocks closing higher than they opened, crossing up through their 25 Stochastic level, and on 150% + greater than average six-month volumey)
More... Stock Picks Page #1
Daily Market Commentary
Updated Friday, 6/2 for Monday's market
Consolidation
Read More...
Updated Friday, 6/2 for Monday's market
| Key DOW Levels for 6/2 | |
| UP | Above 11,300 |
| DN | Below 11,080 |
Consolidation
- The Dow maintains tight consolidation range.
- The S&P and NASDAQ both established short-term consolidation ranges. As these consolidation ranges have been established above violated resistance levels, we should be prepared for the possibility of a bullish continuation early in next week's trading.
Summary
For Monday’s session, we will focus on 11,200 and 11,300. A decisive break outside these boundaries will likely indicate the next directional bias. However, if neither of the boundaries are violated, we could witness a brief period of range bound trading characterized by reversals near noted support and resistance levels.
NASDAQ Chart of the Day
Daily Trading Signals
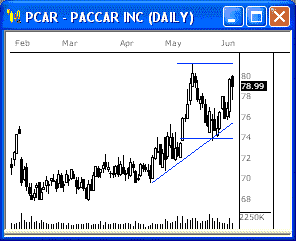
PCAR is approaching near term resistance near 81. A strong break above 81 will have clear bullish implications and would likely lead to profound strength. However, a failure to penetrate above 81 would signal the potential for a double top formation. A reversal off of 81 would likely result in sharp decline toward 74.
Daily Trading Signals
![]()