Friday, July 21, 2006
NASDAQ Chart of the Day

Daily Trading Signals
VECO is winding up within the boundaries of a large triangle range and looks ready for a breakout. Watch 24.25 up, and 22.00 down.
Daily Trading Signals
NYSE Chart of the Day

Daily Trading Signals
PKD is winding up within the boundaries of a clear triangle consolidation after dropping steadily since April. Watch for a breakout from this range for the next key move: 7.10 up, and 6.60 down.
Daily Trading Signals
Daily Market Commentary
Updated Thursday, 7/20 for Friday's market
Steady Pull-back
Read More...
Updated Thursday, 7/20 for Friday's market
| Key DOW Levels for 7/21 | |
| UP | Above 11,050 |
| DN | Below 10,750 |
Steady Pull-back
- Dow pulls back from yesterday's highs, but remains above 10,900. Indey tried to hold on to yesterday's big gains today, but eventually succumbed to weakness and trended steadily lower throughout the session for an 83 point loss, as seen in the 15 and 60 Minute Charts. However, despite today's pull-back, the index remains cautiously bullish.
- The NASDAQ led the broader market lower today, as the index sold off early and often. Keep an eye on key support, as this level could influence the entire market into a much bigger sell-off.
Summary
The Dow closed the day with a sizeable loss after rallying strongly yesterday. However, the index continues to remain near-term bullish as long as it can hold above 10,850 to 10,900. An upside break through 11,050 could reinvigorate bulls; while a break below 10,750 will make for a test of major support at 10,700.
Trading Ideas & Picks
Trading Picks - Read More
The entire homebuilding sector has been under siege for months; most days have brought lower prices, and many stocks are now off their highs by more than 50%. On the backs of positive fed comments, BZH, like most homebuilders, is now showing signs that a short-term reversal may occur...
Trading Education Tutorial
Trading Ranges

Big Moves Occur Outside of the Range
Read More...
Trading Ranges
Big Moves Occur Outside of the Range
A trading range is basically a horizontal channel in which a security moves from the high and low of the channel for an extended amount of time. Obviously, the upper level of the range can be considered resistance and the lower level represents support. Trading within a range is possible, but it's the breakout from the range that provides the best opportunities...
Read More...
Thursday, July 20, 2006
Daily Market Commentary
Updated Wednesday, 7/19 for Thursday's market
Breakout & Rally
Read More...
Updated Wednesday, 7/19 for Thursday's market
| Key DOW Levels for 7/20 | |
| UP | Above 11,150 |
| DN | Below 10,750 |
Breakout & Rally
- Dow breaks consolidation to upside, rallies fiercely to the Close. Breakout from the consolidation coupled with the bounce at 10,700 led to a huge 350-plus point reversal from yesterday's lows, which is huge. Look for a continuation pattern to form at the highs before another key move is seen..
- The S&P and NASDAQ each broke out of clear consolidations today, but the tech-heavy index clearly lagged the broader market. Each index closed the day near the session highs, which is where we could see signs of a possible continuation pattern.
Summary
The Dow ended the day sharply higher after getting a major upside break from the tight consolidation today. The index closed the day at the session's highs and will likely build out a continuation pattern before another move is seen. Watch 11,150 for a serious upside continuation.
NASDAQ Chart of the Day

Daily Trading Signals
WIRE is winding up within the boundaries of a large triangle range and is currently testing the upper boundary at 34.75. Watch for a breakout in this zone for strength.
Daily Trading Signals
NYSE Chart of the Day

Daily Trading Signals
AMT is beginning to break out of a large triangle consolidation at 32.00, which is bullish. Watch for strength above 32.80 for further confirmation.
Daily Trading Signals
Trading Education Tutorial

Read More...
Three types of gaps that are of relevance to investors - the breakaway gap, the measured (or continuation) gap, and the exhaustion gap. We previously discussed the breakaway gap, but it is important to discuss the measured gap and exhaustion gap at the same time. Why? Because it is difficult to tell one from the other until after the fact.
Read More...
Wednesday, July 19, 2006
Trading Ideas & Picks
Trading Picks - Read More
ZION's chart has several bullish features: the stock rose strongly on high volume Monday, the fast stochastic rose above the slow stochastic in oversold territory on Monday, the stock is near support...
Daily Market Commentary
Updated Tuesday, 7/18 for Wednesday's market
10,700 Holds
Read More...
Updated Tuesday, 7/18 for Wednesday's market
| Key DOW Levels for 7/19 | |
| UP | Above 11,000 |
| DN | Below 10,675 |
10,700 Holds
- Dow bounces at 10,700, rallies to the Close. The index struggled in this zone briefly and then got a solid 120 point reversal from the lows to end the day with a nice 52 point gain.
- The S&P and NASDAQ each reversed from key lows today and are now winding up within expanding consolidations. Watch these ranges for key direction tomorrow.
Summary
The Dow closed the day within the boundaries of a clear consolidation that has formed at the lows above major support at 10,700. Watch this range closely for a solid breakout move tomorrow.
NASDAQ Chart of the Day

Daily Trading Signals
DBRN is holding within the boundaries of a very clear triangle range. Watch the boundaries of this range for a solid breakout opportunity. Watch 25.60 up, and 22.40 down.
Daily Trading Signals
NYSE Chart of the Day

Daily Trading Signals
RTK got a nice breakaway gap and rallied through the upper boundary of a large triangle range on high volume today, which is very bullish. Watch for continued strength above 5.40.
Daily Trading Signals
Tuesday, July 18, 2006
Trading Tools
Shogun Swing Trading - Best Swing Trading:
Shogun Trading's approach can benefit all stock traders, from day traders to long term swing traders. We are proud to show some of the best Performance in Day Trading, Longer Term Swing Trading Strategy, Systemized Swing Trading and through our Educational Courses and Videos... » Get More Info Now!
Shogun Trading's approach can benefit all stock traders, from day traders to long term swing traders. We are proud to show some of the best Performance in Day Trading, Longer Term Swing Trading Strategy, Systemized Swing Trading and through our Educational Courses and Videos... » Get More Info Now!
Trading Ideas & Picks
Trading Ideas - Read More
BIDU put in a very aggressive day in comparison to the rest of the market; The close above consolidation pattern resistance could mean stock is ready to run. Keep a close eye on the resistance turned support at 91.85...
Trading Ideas - Read More
Daily Market Commentary
Updated Monday, 7/17 for Tuesday's market
Consolidation
Read More...
Updated Monday, 7/17 for Tuesday's market
| Key DOW Levels for 7/18 | |
| UP | Above 10,900 |
| DN | Below 10,690 |
Consolidation
- Dow holds near support area. The index spent the remainder of the session in tight consolidation and closed with negligible 8 point gain.
- The S&P and NASDAQ both traded in relative inactive fashion. Likewise, both indexes have established tight consolidation patterns and are trading near crucial support levels.
Summary
Considering the magnitude of recent losses, today's short-term consolidation was not unexpected. For Tuesday’s session we will continue to focus on the support near 10,700 for an early indication of bias. However, we may see a continued consolidation and/or retracement in the near=term as the index gears up for next decisive break.
NYSE Chart of the Day

Daily Trading Signals
Examination of the daily chart shows that OMX has established a narrowing triangle pattern. Typically, consolidation of this nature suggests a definitive break is forthcoming. Look to establish a long position above 43. Conversely, look to establish a short position with a decline below 39.
Daily Trading Signals
NASDAQ Chart of the Day

Daily Trading Signals
PTEN has established a downward sloping trend channel. A break above 27 will indicate a potential bullish change in trend and could lead to a rally back toward recent highs near 35. However, a break below 23 will indicate that the overall downtrend remains intact and could trigger additional weakness.
Daily Trading Signals
Trading Tools
Get Ahead of the Game
Selection of trading software and trading services that can help you trade better. Find which stocks or options to trade and get accurate Buy/Sell/Sell Short signals to enter and exit trading positions in a timely manner. Whether you are a beginner or an experienced trader this products will be able to help you maximize your potential and returns.
Monday, July 17, 2006
Shogun Swing Trading Services
Read More...
Shogun Trading's approach can benefit all stock traders, from day traders to long term swing traders. We are proud to show some of the best Performance in Day Trading, Longer Term Swing Trading Strategy, Systemized Swing Trading and through our Educational Courses and Videos...
Read More...
Trading Ideas & Picks
Despite a weak market, WOOF has been performing quite well; the stock is up over 25% from June lows; Volume has followed the stock up and down...
Trading Picks - Read More
Despite a weak market, WOOF has been performing quite well; the stock is up over 25% from June lows; Volume has followed the stock up and down...
Trading Ideas & Picks
Stock Picks - Daily Long (COP SLB MHL RSH) and Short (UVN HXL) Potential Swing Candidates....
Trading Ideas - Read More
Stock Picks - Daily Long (COP SLB MHL RSH) and Short (UVN HXL) Potential Swing Candidates....
Trading Ideas - Read More
Trading Ideas & Picks
Stock Picks - Daily Long (COP SLB MHL RSH) and Short (UVN HXL) Potential Swing Candidates....
Trading Ideas - Read More
Stock Picks - Daily Long (COP SLB MHL RSH) and Short (UVN HXL) Potential Swing Candidates....
Trading Ideas - Read More
NASDAQ Chart of the Day
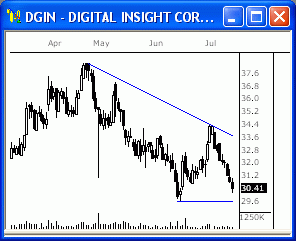
Daily Trading Signals
DGIN is trading near a potential support area near 29.5. A break below 29.5 would signify a bearish continuation move and a resumption of the over all downtrend which has persisted since late April. However, a break above 33.6 would indicate a bullish change in trend and could trigger a rally back toward April highs.
Daily Trading Signals
NYSE Chart of the Day

Daily Trading Signals
DFC has established a clear trading range over the last three months. Look for strong directional break outside the established trading boundaries to determine future bias. Look to establish a long position with a break above 10.2. Conversely, look to establish a short position with a violation of 8.8.
Daily Trading Signals
Technical Indicators
Directional Movement Index (ADX)
Read More...Directional Movement helps determine if a security is "trending." Developed by Welles Wilder and explained in his book, New Concepts in Technical Trading Systems, it can be used either as a system on its own or as a filter on a trend-following system.
Two lines are generated in a DMI study, +DI and -DI. The first line measures positive (upward) movement and the second number measures negative (downward) movement. A buy signal is given when the +DI line crosses over the - DI line while a sell signal is generated when the +DI line crosses below the - DI line.
Two lines are generated in a DMI study, +DI and -DI. The first line measures positive (upward) movement and the second number measures negative (downward) movement. A buy signal is given when the +DI line crosses over the - DI line while a sell signal is generated when the +DI line crosses below the - DI line.
Daily Market Commentary
Updated Friday, 7/14 for Monday's market
Downtrend Continues
Read More...
Updated Friday, 7/14 for Monday's market
| Key DOW Levels for 7/17 | |
| UP | Above 10,900 |
| DN | Below 10,690 |
Downtrend Continues
- Dow trading in close proximity to June lows. The index end the day with a 106 point loss to amass its third straight triple digit loss.
- The NASDAQ and S&P both continued to trade within the framework of the recently established downtrend and again closed near session lows. While the overall downtrend remains intact, the indexes did display a degree stability in late-session trading and are currently consolidating.
Summary
The Dow continued its downward slide and remains notably bearish in nature. However, the index is trading near key support. A directional break above or below this key support area will likely provided a clear means to determine future bias.
![]()