Saturday, July 15, 2006
Quantum Swing Trader
Exclusive Preview
Friday, July 14, 2006
Stormchaser Technologies
StormChaser Technologies Systems
Read More...Stormchaser Technologies is an Automated Trading Systems Solutions Provider for Active Traders, Hedge Funds and Broker-Dealers. Whether you need to scan through a large universe of symbols, to back-test your trading system against historical data, or to implement multiple Black Box Trading Systems, Stormchaser Technologies has the solution for you!...
NASDAQ Chart of the Day
Daily Trading Signals
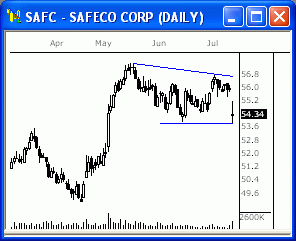
SAFC is trading in close proximity to a potential support level near 53.8. A break below 53.8 could provide the catalyst for a profound capitulation toward April lows. However, should support remain intact, we could see near term strength and a retest of recent highs near 56.8.
Daily Trading Signals
NYSE Chart of the Day

Daily Trading Signals
PEP has pentrated above the upper resistance level of its recently established trading range. Continued strength above 62.5 will provide a bullish confirmation to recent strength and could lead further upward gain.
Daily Trading Signals
Daily Market Commentary
Updated Thursday, 7/13 for Friday's market
Below 10,800
Read More...
Updated Thursday, 7/13 for Friday's market
| Key DOW Levels for 7/14 3 | |
| UP | Above 11,150 |
| DN | Below 10,800 |
Below 10,800
- Dow breaks below major lower trend line and capitulates. The index opened firmly below the major trend line, suggesting potential for continued weakness toward June lows. After a period of consolidation, the index capitulated lower and closed with a 145 point loss.
- The NASDAQ and S&P both experienced notably weakness during today's session. In similar fashion to yesterday's session, the indexes closed near intraday lows and appear to have established a clear short-term downtrend.
Summary
The Dow continued to display the bearish sentiment established during yesterday's session. While most technical indication suggest additional weakness, we should exercise a degree of caution in the near-term. Considering the magnitude of the recent decline, we could a see period of consolidation and/or upward retracement before the downtrend resumes in earnest.
Thursday, July 13, 2006
Trading Ideas & Picks
Daily Long (DNA HANS CMX HPQ) and Short (EBAY CVTX SHY HMA) Potential Swing Candidates...
Trading Ideas - Read More
Daily Long (DNA HANS CMX HPQ) and Short (EBAY CVTX SHY HMA) Potential Swing Candidates...
Trading Ideas - Read More
NYSE Chart of the Day

Daily Trading Signals
DJ is holding within the boundaries of a clear consolidation that has formed from 33.25 to 35.75. A breakout from this range should yield solid movement. Watch 33.70 down and 35.00 up.
Daily Trading Signals
NASDAQ Chart of the Day

Daily Trading Signals
SEAC continues to wind up within a large triangle range that could be potent upon a breakout. Watch 6.40 for weakness and 7.25 for strength.
Daily Trading Signals
Daily Market Commentary
Updated Wednesday, 7/12 for Thursday's market
Steady Sell-Off
Read More...
Updated Wednesday, 7/12 for Thursday's market
| Key DOW Levels for 7/13 | |
| UP | Above 11,150 |
| DN | Below 10,975 |
Steady Sell-Off
- Dow sells off quickly, steadily to the Close. The index closed the day at the lows of the session with a 122 point loss and has now broken the major lower trend line at 11,050, which could add to selling to close out the week.
- The NASDAQ and S&P each sold off steadily today, but the tech-heavy index definitely led the way. Each index is finding new lows, which could breed more selling.
Summary
The Dow ended the day with a big loss after dropping from yesterday's highs throughout the session. The index is now beginning to violate a clear lower trend line that could make for big weakness ahead. Watch 11,150 for the earliest signs of potentially lasting strength.
Technical Indicators
Rate of Change
Rate of Change
Read More...Rate of Change
The Rate of Change is an oscillator that displays the difference between the current price and the price x-time periods ago. As prices increase, the ROC rises and as prices fall, the ROC falls. The greater the change in prices, the greater the change in the ROC.
The 10-day ROC is an excellent short - to intermediate term overbought/oversold indicator. The higher the ROC, the more overbought the security; when the ROC falls expect a rally. As with all overbought/over-sold indicators, watching for the market to start its correction before placing a trade. Often extremely overbought/oversold readings usually imply a continuation of the current trend and any overbought market may remain that way for some time.
The 10-day ROC is an excellent short - to intermediate term overbought/oversold indicator. The higher the ROC, the more overbought the security; when the ROC falls expect a rally. As with all overbought/over-sold indicators, watching for the market to start its correction before placing a trade. Often extremely overbought/oversold readings usually imply a continuation of the current trend and any overbought market may remain that way for some time.
Wednesday, July 12, 2006
Daily Stock Picks
Bottoming -
July 11 for July 12:
AATI ADTN AMAT AMFI ATMI ATVI BPOP CAMD CECO CMVT DEIX DELL DRTE ENTG EPAY EXTR GNTX HHGP IDWK IPAS KOPN MCRL MRCY MXIM NMSS
(Stocks making a 52 WK low but closing higher than they opened)
Oversold Stocks -
July 11 for July 12:
ASMI ATHR HRAY QSFT RHAT RSYS WBSN
(Stocks closing higher than they opened, crossing up through their 25 Stochastic level, and on 150% + greater than average 6 month volume)
Overreaction -
July 11 for July 12:
COSI QMED SBEI VLTS
(Potential Bullish Bounce: Stocks making a 52 WK low and moving down 10% or more in one day)
More... Stock Picks Page #1
NASDAQ Chart of the Day

Daily Trading Signals
PFGC is holding firmly at key support at 29.20, which we will watch for signs of a break or bounce. This level will likely decide direction soon.
Daily Trading Signals
NYSE Chart of the Day

Daily Trading Signals
BEC is holding just beneath a major resistance level at 57.00, which has held since February. Watch this zone closely for a break or bounce for key movement.
Daily Trading Signals
Daily Market Commentary
Updated uesday, 7/11 for Wednesday's market
Late-Day Rally
Read More...
Updated uesday, 7/11 for Wednesday's market
| Key DOW Levels for 7/12 | |
| UP | Above 11,200 |
| DN | Below 11,025 |
Late-Day Rally
- The Dow opened the session with a highly bearish tone this morning and pushed directly to the clear lower trend line from the 60 Minute Chart. The index bounced around at 11,050 and eventually got a sharp upside reveral from the lower trend line en route to a solid 100 point rally from lows.
- The NASDAQ and S&P closed the day strongly and could be headed much higher, especially if the bullish consolidation in the S&P is solidly broken. Watch this range closely.
Summary
The Dow closed the day at the highs of the session after bouncing sharply higher from the key lower trend line at 11,050. The index will likely get another swing higher within the current uptrend back toward the 11,300 zone. If 11,300 is solidly crossed, big strength could be seen.
Tuesday, July 11, 2006
Quantum Swing Trader
Exclusive Preview
Exclusive Preview
Profit Pulling Swing Trading Principles
Earlier this year, a groundbreaking report was released to the swing trading community that revealed the answers to the top 12 questions asked in a survey sent out to over 20,000 traders.
These answers provided step-by-step, core swing trading strategies and tactics with laser-like clarity such as:
** How to "weed out" the best stocks to trade every night from the over 8,000 available...
** The best timeframes for trading stocks...
** How to determine initial top loss, trailing stops, and exit points...
** Potent and proven money management rules...
** ...and a ton more
During its limited 4 week release, over 30,000 traders from over 120 different countries downloaded this report
...and then it was taken off the market.
** Until now **
For just the next couple of weeks, I've been given special permission from 30+ year trading veteran (and one of my mentors) to send you a copy of his brand new update to his now classic swing trading report... "on the house".
Here's your personal download link:
Get Your FREE Copy NOW
(Note: The author plans on selling this report for between $47 and $97 in the near future, but for now it's yours with my compliments.)
Originally 33 pages, "Profit Pulling Swing Trading Principles" is now a 53 page report that's busting at the "digital seams" with the crucial information that swing traders use to potentially profit in the markets.
I like to think of this as a "swing trader's manifesto" that should be read more than once by any one who is serious about trading stocks the right way. In fact, what you are about to read is more valuable to you than what you will find in many trading courses that you'd have to pay for.
** The Lost Questions **
After releasing this report for the first time, its author was bombarded with even more questions about swing trading. The answers to these are now included in this update as "the lost questions".
I know you'll find this report informative and pertinent to your trading, and I believe it will become a permanent addition to your trading library.
Profit Pulling Swing Trading Principles
Daily Market Commentary
Updated Monday, 7/10 for Tuesday's market
Pop and Drop
Read More...
Updated Monday, 7/10 for Tuesday's market
| Key DOW Levels for 7/11 | |
| UP | Above 11,200 |
| DN | Below 11,050 |
Pop and Drop
- Dow rallies at Open, but sells off steadily to the Close.
- The NASDAQ led the broader market lower today, as it pushed steadily down throughout the session. The S&P and NASDAQ have now reached major lower levels that could greatly influence medium term direction.
Summary
The Dow ended the day at the lows of the session after reversing sharply from early highs. The index still managed to close the day with a gain, but is approaching a key lower level at 11,050 that could turn the tide to bearish. Watch this fulcrum closely tomorrow.
NASDAQ Chart of the Day
Daily Trading Signals
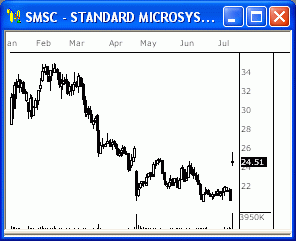
SMSC has gotten a huge breakaway gap on high volume, which is very bullish. If the stock can plow through 26.00, we could see much more strength ahead.
Daily Trading Signals
NYSE Chart of the Day

Daily Trading Signals
LRY has formed a clear resistance level at 45.20, which is also the neck line of a large inverted head-and-shoulders pattern. This pattern can be highly bullish. Watch for a break or bounce at key resistance at 45.20 for the next big move.
Daily Trading Signals
Technical Indicators
Average True Range
Read More...Average True Range or ATR is a measurement of volatility. It measures the average of true price ranges over time. The True Range is the greatest distance between today's high to today's low, yesterday's close to today's high, or yesterday's close to today's low. The Average True Range is a moving average of the True Ranges.
High ATR values often occur at market bottoms following a "panic" sell-off. Low Average True Range values are often found during extended sideways movement, like as those found at market tops or after consolidation periods. True Range is used in Welles Wilder's Directional Movement indicator as well as Donald Mart's Master Trading Formula and is a common volatility ratio. The ATR can be used in a channel breakout method of trading by adding or subtracting from the previous bar's close or the current bar's open.
High ATR values often occur at market bottoms following a "panic" sell-off. Low Average True Range values are often found during extended sideways movement, like as those found at market tops or after consolidation periods. True Range is used in Welles Wilder's Directional Movement indicator as well as Donald Mart's Master Trading Formula and is a common volatility ratio. The ATR can be used in a channel breakout method of trading by adding or subtracting from the previous bar's close or the current bar's open.
Monday, July 10, 2006
Trading Ideas & Picks
Daily Long (NEM, GG, LINTA, WMB) and Short (LBTYA, TLAB, BOL, TOL, MDT) Potential Swing Candidates...
Trading Ideas - Read More
Daily Long (NEM, GG, LINTA, WMB) and Short (LBTYA, TLAB, BOL, TOL, MDT) Potential Swing Candidates...
Trading Ideas - Read More
Trading Ideas & Picks
Based on our analysis of corporate governance, recent growth, long-term growth, growth projections, stock ownership, and valuations, we believe Nautilus, Inc. to be undervalued.
Technical analysis indicators are neutral for NLS...
Trading Picks - Read More
Based on our analysis of corporate governance, recent growth, long-term growth, growth projections, stock ownership, and valuations, we believe Nautilus, Inc. to be undervalued.
Technical analysis indicators are neutral for NLS...
Daily Market Commentary
Updated Friday, 7/7 for Monday's market
Steady Sell-Off
Read More...
Updated Friday, 7/7 for Monday's market
| Key DOW Levels for 7/10 | |
| UP | Above 11,200 |
| DN | Below 11,000 |
Steady Sell-Off
- Dow breaks back below 11,200, drops steadily to the Close.
- The S&P and NASDAQ each sold off late in the day after beginning the session in weak fashion. The S&P is testing key support levels; while the NASDAQ has yet to develop a serviceable pattern. Watch support in the S&P for directional clues Monday.
Summary
The Dow closed the day near the lows of the session after getting an early break through 11,200. The index looks fairly weak in the near term, but could hold above 11,000 support. Look for the index to remain within the current overall uptrend that has lasted since June.
NASDAQ Chart of the Day

Daily Trading Signals
CERN has formed a clear triangle consolidation at the lows of the lastest overall decline. A downside break from this pattern at 36.00 could make for huge weakness. Also watch 40.00 for big strength.
Daily Trading Signals
NYSE Chart of the Day
Daily Trading Signals
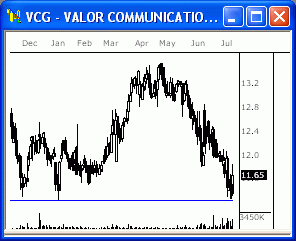
VCG is holding at key support at 11.25, which has held firmly throughout the year. Watch this zone for a solid break or bounce for the next key move.
Daily Trading Signals
![]()