Friday, November 03, 2006
Technical Indicators
Aroon Oscillator
Read More...Developed by Tushar Chande, the Aroon Oscillator is based upon his Aroon Indicator. Much like the Aroon Indicator, the Aroon Oscillator measures the strength of a trend.
The Aroon Oscillator is constructed by subtracting Aroon Down from Aroon Up. Since Aroon Up and Aroon Down oscillate between 0 and +100, the Aroon Oscillator oscillates between -100 and +100 with zero as the center crossover line. The Aroon Oscillator signals an uptrend if it is moving towards its upper limit. It signals a downtrend when it is moving towards the lower limit. The closer the Aroon Oscillator value is to either extreme the stronger the trend.
The Aroon Oscillator is constructed by subtracting Aroon Down from Aroon Up. Since Aroon Up and Aroon Down oscillate between 0 and +100, the Aroon Oscillator oscillates between -100 and +100 with zero as the center crossover line. The Aroon Oscillator signals an uptrend if it is moving towards its upper limit. It signals a downtrend when it is moving towards the lower limit. The closer the Aroon Oscillator value is to either extreme the stronger the trend.
Trading Education Tutorial
Triangles

Tightening Price Action Leads to a Breakout
There are various forms of consolidation and they occur anytime there is an equilibrium of buyers and sellers. One of the most predictive consolidation formations is the triangle.
Read More...
Triangles

Tightening Price Action Leads to a Breakout
There are various forms of consolidation and they occur anytime there is an equilibrium of buyers and sellers. One of the most predictive consolidation formations is the triangle.
Read More...
NASDAQ Chart of the Day

Daily Trading Signals

SMTC is winding up within the boundaries of a large triangle range that could spark a huge breakout move. Watch 13.75 up, and 12.25 down for a breakout.
Daily Trading Signals
NYSE Chart of the Day

Daily Trading Signals

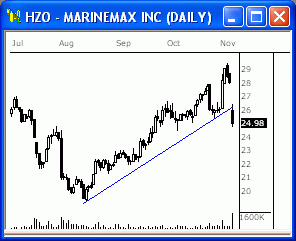
HZO has broken a clear trend line to the downside via a sizeable breakaway gap and increased volume, which is quite bearish. Look for more weakness from this stock.
Daily Trading Signals
Daily Market Commentary
Updated Thursday, 11/2 for Friday's market.
Holding...
Read More...
Updated Thursday, 11/2 for Friday's market.
| Key DOW Levels for 11/3 | |
| UP | Above 12,050 |
| DN | Below 11,950 |
Holding...
- Dow tests 12,000, trades quietly sideways to the Close. The index struggled at 12,000 throughout the day and basically sat idle before closing the session with a 12 point loss.
- The NASDAQ and S&P each held at their respective lows today, as very tight consolidations formed. Look for a breakout from these patterns for key direction.
Summary
The Dow ended the day quietly, as the index basically traded sideways the entire session. The index continues to spar with the 12,000 level, which we will continue to watch the next key move.
Read More...
Thursday, November 02, 2006
Trading Ideas & Picks
Trading Ideas - Read More
PCAR: Technical indicators are suggesting that we could see a pullback toward the ascending trendline. The Parabolic SAR indicator has recently produced a sell signal. The MACD, which has recently crossed below its signal line. This bearish crossover could also be used by traders to confirm a move toward the support near $57.
Trading Ideas & Picks
Trading Picks - Read More
YHOO: Recent price momentum has been favorable to those holding long positions in the stock. The upside price action has pushed YHOO to downtrend line resistance. Being that this resistance level has only been tested successfully on one previous occasion, the validity is still uncertain...
Trading Tools
Shogun Swing Trading - Best Swing Trading:
Shogun Trading's approach can benefit all stock traders, from day traders to long term swing traders. We are proud to show some of the best Performance in Day Trading, Longer Term Swing Trading Strategy, Systemized Swing Trading and through our Educational Courses and Videos... » Get More Info Now!
Shogun Trading's approach can benefit all stock traders, from day traders to long term swing traders. We are proud to show some of the best Performance in Day Trading, Longer Term Swing Trading Strategy, Systemized Swing Trading and through our Educational Courses and Videos... » Get More Info Now!
Trading Education Tutorial
Volume Climax

Volume Helps Identify Reversals
Various price patterns can alert us to potential reversal candidates. Trendline Breaks, Support and Resistance Levels, Fibonacci Retracement Levels and other price information are valuable in determining a change in direction for a security. However, one of the most overlooked chart patterns that help us determine reversals is not reflected in the price itself. Volume climaxes are easily identifiable and valuable in assessing a change in market sentiment.
Read More...
Volume Climax

Volume Helps Identify Reversals
Various price patterns can alert us to potential reversal candidates. Trendline Breaks, Support and Resistance Levels, Fibonacci Retracement Levels and other price information are valuable in determining a change in direction for a security. However, one of the most overlooked chart patterns that help us determine reversals is not reflected in the price itself. Volume climaxes are easily identifiable and valuable in assessing a change in market sentiment.
Read More...
NASDAQ Chart of the Day

ADTN is getting an initial downside break from the large triangle range at 22.50, which could spark a significant drop in this stock. Watch for more weakness to come.
Daily Trading Signals

ADTN is getting an initial downside break from the large triangle range at 22.50, which could spark a significant drop in this stock. Watch for more weakness to come.
Daily Trading Signals
NYSE Chart of the Day

Daily Trading Signals

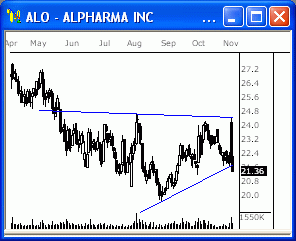
ALO has filled a large exhaustion gap to the downside and is now breaking a large triangle through the bottom as well, which is highly bearish. Watch for continued weakness from this stock beneath 21.50.
Daily Trading Signals
Daily Market Commentary
Updated Wednesday, 11/1 for Thursday's market.
Approaching 12,000...
Read More...
Updated Wednesday, 11/1 for Thursday's market.
| Key DOW Levels for 11/2 | |
| UP | Above 12,125 |
| DN | Below 12,000 |
Approaching 12,000...
- Dow ells early advance, drops just shy of key 12,000 level. The index came within a few points of hitting the key 12,000 zone and bounced to the Close for an eventual 51 point loss.
- The NASDAQ and S&P each sold off big compared to the Dow today, especially the tech-heavy index. Today's break could be the first spark to big selling this month.
Summary
The Dow closed the day with a nice bounce that recovered some of the day's losses, but the index remains vulnerable to key weakness ahead. Watch 12,000 closely, as a break or bounce in this zone could influence the next key medium term move.
Read More...
Wednesday, November 01, 2006
Trading Education Tutorial
Profit Taking
Read More...
Profit Taking
Psychologist, Dr. Daniel Kahneman (The Nobel prize in economics - the field of behavioral economics) basically shows that investors are irrational, but predictably irrational. They continue to make the same mistakes over and over. One of the biggest is a common inability to take a loss: taking a loss is so painful, it is simply avoided.
A trader's most valuable commodity is trading capital. What is the most important rule for a trader? Preserve your capital. This is what keeps a trader in the game, and it is foolish to do anything that will jeopardize it. Subsequently, to preserve a trader's capital, there are rules that help a trader, whether in short, intermediate or long term play.
The rules listed below are suggestions. Only the trader can decide which rule is important. However, when a trader decides on a set of rules, they should be used consistently. Rules make up a trader’s system and are enforced by discipline.
Read More...
NYSE Chart of the Day

Daily Trading Signals

OSK has broken a large triangle range to the downside via a solid breakaway gap and high volume, which is quite bearish. Watch for steady weakness from this pattern.
Daily Trading Signals
NASDAQ Chart of the Day

Daily Trading Signals

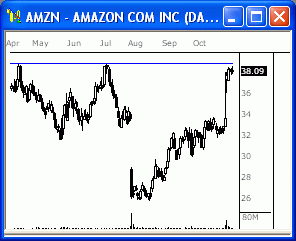
AMZN is holding at major resistance at 38.85, which has held since April. Watch for weakness away from this zone, unless a violation is seen.
Daily Trading Signals
Trading Education Tutorial
Reward:Risk Ratio

Assessing a Trades Potential
When looking at a stock to buy, we look to various tools and techniques to help us assess the probability of its upward movement. However, will it go up is not the only question to ask - we also need to analyze the chart to see how far it is likely to go up and also how much of a loss we are willing to take to allow it to reach it's profit potential. The potential profit of a trade divided by the potential loss of trade is known as the Reward:Risk Ratio.
Read More...
Reward:Risk Ratio

Assessing a Trades Potential
When looking at a stock to buy, we look to various tools and techniques to help us assess the probability of its upward movement. However, will it go up is not the only question to ask - we also need to analyze the chart to see how far it is likely to go up and also how much of a loss we are willing to take to allow it to reach it's profit potential. The potential profit of a trade divided by the potential loss of trade is known as the Reward:Risk Ratio.
Read More...
Daily Market Commentary
Updated Tuesday, 10/31 for Wednesday's market.
Volatile Session...
Read More...
Updated Tuesday, 10/31 for Wednesday's market.
| Key DOW Levels for 11/1 | |
| UP | Above 12,200 |
| DN | Below 12,000 |
Volatile Session...
- Dow trades in volatile manner, but ends session flat again. The index each traded in full swings today, but continue to build out with major technical patterns, which will play a huge role in early November movement. Watch these patterns closely.
Summary
The Dow ended the day with a nice rise from the afternoon lows. The index continues to hold firmly above 12,000, which looks to be the key fulcrum in the charts. A break or bounce off this level will likely determine the next medium term move.
- The NASDAQ and S&P each traded in full swings today, but continue to build out with major technical patterns, which will play a huge role in early November movement. Watch these patterns closely.
Summary
The Dow ended the day with a nice rise from the afternoon lows. The index continues to hold firmly above 12,000, which looks to be the key fulcrum in the charts. A break or bounce off this level will likely determine the next medium term move.
Summary
The Dow ended the day with a nice rise from the afternoon lows. The index continues to hold firmly above 12,000, which looks to be the key fulcrum in the charts. A break or bounce off this level will likely determine the next medium term move.
- The NASDAQ and S&P each traded in full swings today, but continue to build out with major technical patterns, which will play a huge role in early November movement. Watch these patterns closely.
Summary
The Dow ended the day with a nice rise from the afternoon lows. The index continues to hold firmly above 12,000, which looks to be the key fulcrum in the charts. A break or bounce off this level will likely determine the next medium term move.
Read More...
Tuesday, October 31, 2006
Technical Indicators
Negative Volume Index
Read More...Norman Fosback first detailed the Negative Volume Index in his 1976 book, Stock Market Logic. Used in conjunction with the Positive Volume Index, it's an attempt to identify bull markets. These indicators are predicated on the assumption that smart money dominates trading on quiet days while less uninformed investors dominate trading on active days.
Fosback points out the odds of a bull market are 95 out of 100 when the NVI rises above its one-year moving average. The odds of a bull market are roughly 50/50 when the NVI is below its one-year average. Following this logic, the NVI is most useful as a bull market indicator.
Fosback points out the odds of a bull market are 95 out of 100 when the NVI rises above its one-year moving average. The odds of a bull market are roughly 50/50 when the NVI is below its one-year average. Following this logic, the NVI is most useful as a bull market indicator.
Trading Education Tutorial
Trendlines

Determining Market Reversals and Continuations
Trendlines are perhaps the oldest tools known to chartists. Trendlines form across peaks and valleys called pivot points - relative highs and lows in a chart. As more points form along a line, it becomes more "established". This means that, when the line is broken, it will likely follow through with a strong move in the new direction.
Read More...
Trendlines

Determining Market Reversals and Continuations
Trendlines are perhaps the oldest tools known to chartists. Trendlines form across peaks and valleys called pivot points - relative highs and lows in a chart. As more points form along a line, it becomes more "established". This means that, when the line is broken, it will likely follow through with a strong move in the new direction.
Read More...
NASDAQ Chart of the Day

Daily Trading Signals

CPWR has formed a large triangle that could be on the verge of a breakout. Watch 8.10 and 7.40 for a solid breakout from this range, as such a move could spark big movement in the direction of the break.
Daily Trading Signals
NYSE Chart of the Day

Daily Trading Signals

VLO has formed a clear pennant consolidation at the lows, which is highly bearish. However, a break in either direction from this well-developed pattern could spark big movement. Watch 55.00 up and 51.00 down.
Daily Trading Signals
Daily Market Commentary
Updated Monday, 10/30 for Tuesday's market.
Winding Up...
Read More...
Updated Monday, 10/30 for Tuesday's market.
| Key DOW Levels for 10/31 | |
| UP | Above 12,125 |
| DN | Below 12,050 |
Winding Up...
- Dow sells off from highs to begin session, ends day with steep decline. The index closed the day with a negligible 4 point loss, but is now winding up within a clear triangle pattern that could spark movement tomorrow.
- The NASDAQ and S&P each recouped the day's early losses and are now winding up within clear technical patterns. Watch for a breakout for the next key move.
Summary
The Dow closed the day flat in terms of points, but could be gearing up for a big move out of the clear triangle pattern. Watch this pattern for the next key directional move.
Read More...
Monday, October 30, 2006
Trading Ideas & Picks
Trading Picks - Read More
QQQQ: One point of interest is how the QQQQ has been unable to slip below the support of the 15 DMA since it reversed the downtrend in mid August. We'd expect to see the bulls continue to drive the QQQQ higher and will watch closely to see how the $43 resistance will be able to affect the short-term direction of the price...
Daily Stock Picks
Bottoming -
Oct 27 for Oct 30:
ANLY BLDR SAIA
(Stocks making a 52 WK low but closing higher than they opened)
Oversold Stocks -
Oct 27 for Oct 30:
IKAN SGMS
(Stocks closing higher than they opened, crossing up through their 25 Stochastic level, and on 150% + greater than average 6 month volume)
Volume Pop -
Oct 27 for Oct 30:
ADSX ASTM CCUR COMS DENN IINT ZHNE
(Potential Bullish Run: Volume Pop With High ADX & RSI)
More... Stock Picks Page #1
NYSE Chart of the Day

Daily Trading Signals

CVX is holding firmly at key resistance at 68.50, which has held since late summer. Watch this zone for a break or bounce for the next key move.
Daily Trading Signals
Trading Education Tutorial
Breakaway Gaps

Pressure Helps Identify Movers
Gaps occur when there is a dramatic change in market conditions. They can occur at the beginning of a trading session (i.e. most NASDAQ stocks) or even during the session itself. There are three types of gaps that are of interest to us when we analyze charts: breakaway, measured (also known as continuation) and exhaustion gaps. Today we will discuss the breakaway gap.
Read More...
Breakaway Gaps

Pressure Helps Identify Movers
Gaps occur when there is a dramatic change in market conditions. They can occur at the beginning of a trading session (i.e. most NASDAQ stocks) or even during the session itself. There are three types of gaps that are of interest to us when we analyze charts: breakaway, measured (also known as continuation) and exhaustion gaps. Today we will discuss the breakaway gap.
Read More...
Daily Market Commentary
Updated Friday, 10/27 for Monday's market.
Late-Day Sell-Off
Read More...
Updated Friday, 10/27 for Monday's market.
| Key DOW Levels for 10/30 | |
| UP | Above 12,200 |
| DN | Below 12,050 |
Late-Day Sell-Off
- Dow sells off from highs to begin session, ends day with steep decline. The index closed the day right at key support at 12,075 with a solid 73 point loss, but much more selling could be ahead.
- The NASDAQ and S&P each sold off sharply late in the day, led by the tech-heavy index. Watch for potential continuation patterns to form to indicate that more selling is likely.
Summary
The Dow closed the day at the lows of the session after getting a huge sell-off late in the day. The index is now testing a major lower trend line at 12,075, which could shed light on the next major directional move.
Read More...
