Friday, August 18, 2006
Trading Signals of the Day
Bullish Reversal Triggers
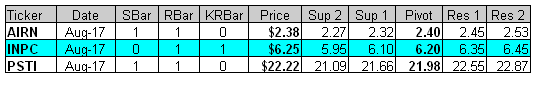

Reversal bars are an objective technique used to time the entry of a trade. Read More... http://daily-stocks.netfirms.com/daily-trading-triggers.htm
Trading Ideas & Picks
Trading Ideas - Read More
SNDK: TA solid $2 move for this stock today as it continued its move from yesterday. See chart for my buy point note from yesterday...
Trading Ideas - Read More
Technical Indicators
Commodity Selection Index (CSI)
Read More...As an indicator of momentum, the Commodity Selection Index, or CSI is designed to help select commodities suitable for short-term trading. Designed for short-term traders who can handle the risks associated with highly volatile markets, a high CSI rating indicates that the commodity has strong trending and volatility characteristics. These characteristics are brought out by the Directional Movement factor in the calculation - the volatility characteristic by the Average True Range factor.
CSI creator Welles Wilder describes his focus to trading commodities with high CSI values. As these commodities are highly volatile, they have the potential to make the quickest return in the shortest time...
CSI creator Welles Wilder describes his focus to trading commodities with high CSI values. As these commodities are highly volatile, they have the potential to make the quickest return in the shortest time...
Trading Education Tutorial
Volatility

Well Behaved Stocks Reap Rewards
Read More...
Volatility
Well Behaved Stocks Reap Rewards
Some stocks move multiple points and multiple directions in one trading session. Other stocks are more methodical in their day-to-day movement. Which type of stock is more attractive to you as an investor.
Read More...
Daily Market Commentary
Updated Thursday, 8/17 for Friday's market
Holding...
Read More...
Updated Thursday, 8/17 for Friday's market
| Key DOW Levels for 8/18 | |
| UP | Above 11,400 |
| DN | Below 11,300 |
Holding...
- Dow holds at highs of recent advance, forms framework for continuation pattern. The index gained just 8 points for the day and looks to be forming the framework for a continuation pattern at the highs. This consolidation range could lead us to our next key move.
- The NASDAQ and S&P each reached new highs today, followed by late-day pull-backs. Each pull-back sparked the formation of a potential consolidation at the highs, which we will watch closely tomorrow.
Summary
The Dow closed the day in much the same way we thought it would, which is quietly and in a 'holding' pattern. Look for the index to continue to build out at the highs before the next key move.
Read More...
Thursday, August 17, 2006
Trading Signals of the Day
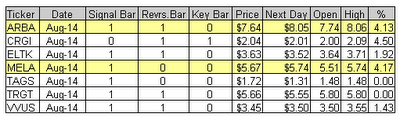
Bullish Reversal Triggers


Reversal bars are an objective technique used to time the entry of a trade. Read More... http://daily-stocks.netfirms.com/daily-trading-triggers.htm
NASDAQ Chart of the Day
XLNX has broken a steep upper trend line via a breakaway gap on increased volume, which is bullish. Watch for continued strength as a result of this gap, especially if XLNX continues to hold above 21.00.
Daily Trading Signals
XLNX has broken a steep upper trend line via a breakaway gap on increased volume, which is bullish. Watch for continued strength as a result of this gap, especially if XLNX continues to hold above 21.00.
Daily Trading Signals
NYSE Chart of the Day

Daily Trading Signals
LSS has gotten a breakaway gap to the upside on increased volume off major support at 43.35, which is bullish. Watch for a break through 48.00 for additional signs of strength back toward prior highs.
Daily Trading Signals
Technical Indicators
Projection Oscillator
Read More...The Projection Oscillator is a by-product of Dr. Mel Widner's Projection Bands. In essense a slope-adjusted Stochastic, the Projection Oscillator shows the relationship of the current price to its minimum and maximum prices over time. Unlike the Stochastic Oscillator, here the minimum and maximum prices are adjusted up or down by the slope of the price's regression line. It is this adjustment that makes the Projection Oscillator so responsive to short-term price moves.
Perhaps the best way to understand the relationship between the Projection Oscillator and Projection Bands is the knowledge that the Oscillator shows where the current price rests between the current location of the bands. A value of 0 indicates that prices are touching the bottom band, a value of 50 indicates that the current price is exactly in the middle of the two bands while a value of 100 indicates that prices are touching the top band...
Perhaps the best way to understand the relationship between the Projection Oscillator and Projection Bands is the knowledge that the Oscillator shows where the current price rests between the current location of the bands. A value of 0 indicates that prices are touching the bottom band, a value of 50 indicates that the current price is exactly in the middle of the two bands while a value of 100 indicates that prices are touching the top band...
Trading Ideas & Picks
Swing Trade of the Week

Trading Ideas - Read More
Swing Trade of the Week
ADBE: Stock surged past a resistance area with a bullish green candle, then traded at the upper end of the bullish breakout candle, representing a consolidation and possible setup for further upside. Look to go long at...
Trading Tools
Shogun Swing Trading - Best Swing Trading:
Shogun Trading's approach can benefit all stock traders, from day traders to long term swing traders. We are proud to show some of the best Performance in Day Trading, Longer Term Swing Trading Strategy, Systemized Swing Trading and through our Educational Courses and Videos... » Get More Info Now!
Shogun Trading's approach can benefit all stock traders, from day traders to long term swing traders. We are proud to show some of the best Performance in Day Trading, Longer Term Swing Trading Strategy, Systemized Swing Trading and through our Educational Courses and Videos... » Get More Info Now!
Trading Education Tutorial
Saucer Patterns

Rare Pattern Is One of the Most Predictive
Read More...
Saucer Patterns
Rare Pattern Is One of the Most Predictive
One of the most predicitive chart patterns you will come across is the saucer pattern. Saucers are also referred to as "bowls" or even "rounded tops or bottoms", and one look at this pattern tells where these names are derived from. However, there is a problem with saucer patterns - they're hard to find.
Read More...
Daily Market Commentary
Updated Wednesday, 8/16 for Thursday's market
Continued Strength
Read More...
Updated Wednesday, 8/16 for Thursday's market
| Key DOW Levels for 8/17 | |
| UP | Above 11,350 |
| DN | Below 11,175 |
Continued Strength
- Dow rallies steadily throughout session, closes above 11,300 level. The index got the break through 11,300 and cruised higher the rest of the day for a big 97 point gain. The index is now holding at three-month highs, which we will watch closely tomorrow.
- The NASDAQ and S&P each pushed steadily higher throughout the session, led by the tech-heavy index. Look for a continuation pattern to form to indicate that continued strength is likely.
Summary
The Dow closed the day with a solid push higher to the Close and is now holding beneath resistance at 11,345. Watch this zone for signs of the next break or reversal. If the index can form a continuation pattern at the highs, we could see much more strength ahead.
Read More...
Wednesday, August 16, 2006
Trading Signals of the Day
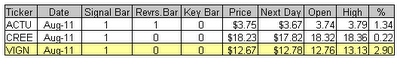
Bullish Reversal Triggers

Reversal bars are an objective technique used to time the entry of a trade. Read More... http://daily-stocks.netfirms.com/daily-trading-triggers.htm
NASDAQ Chart of the Day

Daily Trading Signals
FDRY is testing the upper boundary of a very clear triangle consolidation, which could be very bullish for this stock. An upside break through the top of the triangle at 10.80 could shoot this stock higher. Watch 9.70 for Shorts.
Daily Trading Signals
NYSE Chart of the Day

Daily Trading Signals
PYX is holding at a firm resistance level at 12.00, which has held for several months now. If the index cannot break through this zone, we will likely see another sharp decline back toward the 10.00 zone. Watch this level for a break or bounce.
Daily Trading Signals
Daily Market Commentary
Updated Tuesday, 8/15 for Wednesday's market
Solid Advance
Read More...
Updated Tuesday, 8/15 for Wednesday's market
| Key DOW Levels for 8/16 | |
| UP | Above 11,300 |
| DN | Below 11,175 |
Solid Advance
- Dow sharply at Open, trends higher throughout session. The index held at 11,200 throughout much of the day before finally breaking to the upside to eventually close the day with a solid 132 point gain.
- The NASDAQ and S&P each pushed solidly higher at the Open, but the tech-heavy index led the charge throughout the session. Look for a possible continuation pattern to form to indicate continued strength.
Summary
The Dow closed the day with a nice gain after getting a sharp advance at the Open. The index closed the day at the highs of the session and is now approaching key resistance at 11,300, which we will watch closely for big strength. A break back below 11,175 could be an early sign of weakness.
Read More...
Trading Education Tutorial
Measured and Exhaustion Gaps

Identifiable Patterns After Confirmation Move
Read More...
Measured and Exhaustion Gaps
Identifiable Patterns After Confirmation Move
We have previously mentioned the three types of gaps that are of relevance to investors - the breakaway gap, the measured (or continuation) gap, and the exhaustion gap. We previously discussed the breakaway gap, but it is important to discuss the measured gap and exhaustion gap at the same time. Why? Because it is difficult to tell one from the other until after the fact.
Read More...
Tuesday, August 15, 2006
Trading Signals of the Day
Bullish Reversal Triggers

Reversal bars are an objective technique used to time the entry of a trade. Read More... http://daily-stocks.netfirms.com/daily-trading-triggers.htm
Daily Stock Picks
Bottoming -
Aug 14 for Aug 15:
CBMX CKXE CRIS CYCL NRMX OIIM PARL PSUN
(Stocks making a 52 WK low but closing higher than they opened)
Oversold Stocks -
Aug 14 for Aug 15:
ININ NRMX SBSA
(Stocks closing higher than they opened, crossing up through their 25 Stochastic level, and on 150% + greater than average 6 month volume)
Overreaction -
Aug 14 for Aug 15:
ANTP CCC CDIC CHTP CVTX EVOL IFON MODT MTIC RMIX TVIN
(Potential Bullish Bounce: Stocks making a 52 WK low and moving down 10% or more in one day)
More... Stock Picks Page #1
NYSE Chart of the Day

Daily Trading Signals
VAL has gotten a huge upside break through a clear upper trend line at 25.60, which is very bullish. Look for continued strength from this stock.
Daily Trading Signals
NASDAQ Chart of the Day
Daily Trading Signals
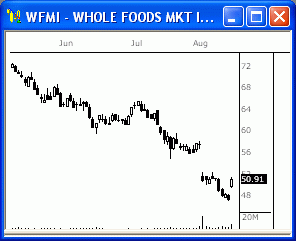
WFMI got a nice breakaway gap to the upside and closed the day in strong fashion. If WFMi can break through resistance at 52.25, we could see much more strength ahead.
Daily Trading Signals
Daily Market Commentary
Updated Monday, 8/14 for Tuesday's market
Round Trip
Read More...
Updated Monday, 8/14 for Tuesday's market
| Key DOW Levels for 8/15 | |
| UP | Above 11,215 |
| DN | Below 11,040 |
Round Trip
- Dow rallies solidly through morning, but gives back gains with late-day sell-off. The index had rallied over 100 points before staging a big downside reversal to the Close, essentially leaving the Dow with a 10 point gain for the day.
- The NASDAQ and S&P each sold off heavily from early gains today, which is not a great sign for bulls. Keep an eye on key support for signs of bigger weakness.
Summary
The Dow rallied hard to begin the session, but easily gave back all the day's gains via a sharp late-day sell-off. The index is now approaching support at 11,050 yet again, which we will continue to watch for big movement.
Read More...
Trading Education Tutorial
Trendlines

Determining Market Reversals and Continuations
Read More...
Trendlines
Determining Market Reversals and Continuations
Trendlines are perhaps the oldest tools known to chartists. Trendlines form across peaks and valleys called pivot points - relative highs and lows in a chart. As more points form along a line, it becomes more "established". This means that, when the line is broken, it will likely follow through with a strong move in the new direction.
Read More...
![]()