Friday, September 22, 2006
Daily Market Commentary
Updated Thursday, 9/21 for Friday's market
Steady Sell-Off
Read More...
Updated Thursday, 9/21 for Friday's market
| Key DOW Levels for 9/22 | |
| UP | Above 11,650 |
| DN | Below 11,475 |
Steady Sell-Off
- Dow breaks consolidation to downside, drops hard to the Close. The break led to a steady sell-off away from the 11,600 level and eventually left the Dow with an 80 point loss.
- The NASDAQ and S&P each pulled back from early highs and proceeded steadily lower upon breaking down from a clear range. Look for each to continue to push back toward prior support.
Summary
The Dow closed the day with a big loss after breaking a tight consolidation to the downside early in the day. The index is now holding just above a clear lower trend line that we will watch closely for big medium term movement. Watch 11,500 closely tomorrow..
Read More...
Trading Education Tutorial
Breakaway Gaps

Pressure Helps Identify Movers
Read More...
Breakaway Gaps
Pressure Helps Identify Movers
Gaps occur when there is a dramatic change in market conditions. They can occur at the beginning of a trading session (i.e. most NASDAQ stocks) or even during the session itself. There are three types of gaps that are of interest to us when we analyze charts: breakaway, measured (also known as continuation) and exhaustion gaps. Today we will discuss the breakaway gap.
Read More...
Thursday, September 21, 2006
Trading Ideas & Picks
Trading Picks - Read More
GOOG: Stock has been trading between the two converging trendlines of a symmetrical triangle pattern. The price action is nearing the apex of the triangle, which many traders view as a decrease in the validity of the pattern's signal...
Trading Ideas & Picks
Trading Ideas - Read More
INTU: Stock surged to new all-time highs with a series of bullish candles. Stock has since traded at the upper end of the bullish breakout, representing a consolidation and possible setup for further upside Look to go long at...
Trading Ideas - Read More
NASDAQ Chart of the Day

EXPD has retraced back to the 38% Retracemet point from the July to August decline. The stock may begin to hit resistance in this 38% range. Watch for a break below 43.00 to indicate that another decline is likely.
Daily Trading Signals
EXPD has retraced back to the 38% Retracemet point from the July to August decline. The stock may begin to hit resistance in this 38% range. Watch for a break below 43.00 to indicate that another decline is likely.
Daily Trading Signals
NYSE Chart of the Day

Daily Trading Signals
RAI got a big downside break through a key lower trend line via a breakaway gap and high volume, which is quite bearish. Watch for continued overall weakness below 60.00.
Daily Trading Signals
Trading Education Tutorial
Volume Climax

Volume Helps Identify Reversals
Read More...
Volume Climax
Volume Helps Identify Reversals
Various price patterns can alert us to potential reversal candidates. Trendline Breaks, Support and Resistance Levels, Fibonacci Retracement Levels and other price information are valuable in determining a change in direction for a security. However, one of the most overlooked chart patterns that help us determine reversals is not reflected in the price itself. Volume climaxes are easily identifiable and valuable in assessing a change in market sentiment.
Read More...
Daily Market Commentary
Updated Wednesday, 9/20 for Thursday's market
Bullish Upmove
Read More...
Updated Wednesday, 9/20 for Thursday's market
| Key DOW Levels for 9/21 | |
| UP | Above 11,650 |
| DN | Below 11,575 |
Bullish Upmove
- Dow rallies at Open, maintains gains to the Close. The index closed the day with a solid 72 point gain and now finds itself within a very tight consolidation, which we will watch closely tomorrow.
- The NASDAQ and S&P each rallied early in the day, followed by sideways movement the rest of the session. Watch today's tight range for directional movement tomorrow.
Summary
The Dow closed the day near the highs of the session after beginning the day highly bullish. The index is now holding at the key 11,600 resistance level that has been rock in the face of strength so far this year. Watch it closely.
Read More...
Trading Ideas & Picks
Trading Ideas - Read More
CRE: Tight lower channels such as this one are common in this market and here we see this stock starting to come out of channel now. Buy point is when the stock moves over the line...
Trading Ideas - Read More
Trading Ideas & Picks
Trading Ideas - Read More
SNDK: This stock could use a rest after a 50% move off its lows, but if the market wishes, this stock just might be on the move again. Next buy point is when the stock makes a move above the trendline at $60...
Trading Ideas - Read More
Trading Tools
Shogun Swing Trading - Best Swing Trading:
Shogun Trading's approach can benefit all stock traders, from day traders to long term swing traders. We are proud to show some of the best Performance in Day Trading, Longer Term Swing Trading Strategy, Systemized Swing Trading and through our Educational Courses and Videos... » Get More Info Now!
Shogun Trading's approach can benefit all stock traders, from day traders to long term swing traders. We are proud to show some of the best Performance in Day Trading, Longer Term Swing Trading Strategy, Systemized Swing Trading and through our Educational Courses and Videos... » Get More Info Now!
NASDAQ Chart of the Day

Daily Trading Signals
SAPE has formed a great saucer pattern and could really get a huge breakout move from this pattern. Watch the lip of the saucer at 5.50 for a potential upside break that could send the stock back toward the 8.00 zone.
Daily Trading Signals
NYSE Chart of the Day
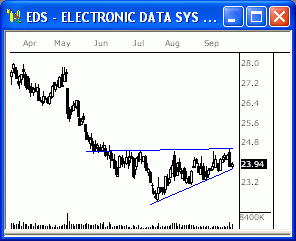
Daily Trading Signals
EDS has formed a large triangle consolidation at the current lows and looks poised for a solid breakout. Watch 24.75 up, and 23.70 down for the potential breakout move.
Daily Trading Signals
Wednesday, September 20, 2006
Technical Indicators
On Balance Volume (OBV)
On Balance Volume (OBV) is a momentum indicator that relates volume to price change. Joseph Granville presented the idea that volume will precede price in his 1963 book, New Key to Stock Market Profits.
On Balance Volume keeps a running total of volume flowing into or out of a security. When the security closes higher than the previous close, all of the day's volume is considered up-volume. A close lower than the previous day's results in all of the day's volume considered down-volume. A rising OBV is defined as a sign of smart money flowing into a security. As the public then moves into the security, both the security and the OBV will surge ahead. If price movement precedes OBV movement, Granville calls this a "non-confirmation." Non-confirmations can occur at bull market tops, when the security rises before/without the OBV or at bear market bottoms when the security falls before/without the OBV...
Read More...On Balance Volume (OBV) is a momentum indicator that relates volume to price change. Joseph Granville presented the idea that volume will precede price in his 1963 book, New Key to Stock Market Profits.
On Balance Volume keeps a running total of volume flowing into or out of a security. When the security closes higher than the previous close, all of the day's volume is considered up-volume. A close lower than the previous day's results in all of the day's volume considered down-volume. A rising OBV is defined as a sign of smart money flowing into a security. As the public then moves into the security, both the security and the OBV will surge ahead. If price movement precedes OBV movement, Granville calls this a "non-confirmation." Non-confirmations can occur at bull market tops, when the security rises before/without the OBV or at bear market bottoms when the security falls before/without the OBV...
Daily Market Commentary
Updated Tuesday, 9/19 for Wednesday's market
V-Bottom Reversal
Read More...
Updated Tuesday, 9/19 for Wednesday's market
| Key DOW Levels for 9/20 | |
| UP | Above 11,625 |
| DN | Below 11,470 |
V-Bottom Reversal
- Dow sells off heavily to begin session, but gets key reversal to rally to the Close. The index dropped back to the 11,480 zone, but got a highly bullish v-bottom reversal that sent the index back to 11,550, essentially ending the day with a 14 point loss.
- The NASDAQ and S&P each reversed sharply from early lows, but continue to look vulnerable to potential selling ahead. Continue to watch near-term support for broader direction.
Summary
The Dow ended the day with a nice reversal from lows, but continues to be vulnerable to a potential downside break through the major lower trend line. Continue to watch 11,470 for major selling pressure; while keeping an eye on 11,600 for another shot at new highs.
Read More...
Trading Education Tutorial
Support and Resistance Levels

History Tells Us When Securites are Overbought or Oversold
Read More...
Support and Resistance Levels
History Tells Us When Securites are Overbought or Oversold
Support indicates a level on the chart where we can expect an increase in the demand for a security (buyers take over). How do we know this? By identifying this reaction to this price level in the chart's history.
Read More...
Trading Signals of the Day
Bullish Reversal Triggers


Reversal bars are an objective technique used to time the entry of a trade. Read More... http://daily-stocks.netfirms.com/daily-trading-triggers.htm
Tuesday, September 19, 2006
NYSE Chart of the Day

KBH is holding firmly beneath key resistance at 48.00. Watch for a break or bounce off this level for key movement.
Daily Trading Signals
KBH is holding firmly beneath key resistance at 48.00. Watch for a break or bounce off this level for key movement.
Daily Trading Signals
NASDAQ Chart of the Day
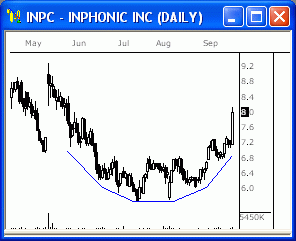
INPC has formed a clear saucer pattern and has broken the lip of the pattern at 7.50, which is highly bullish. Look for more strength out of this pattern moving forward.
Daily Trading Signals
INPC has formed a clear saucer pattern and has broken the lip of the pattern at 7.50, which is highly bullish. Look for more strength out of this pattern moving forward.
Daily Trading Signals
Trading Education Tutorial
Reward:Risk Ratio
Assessing a Trades Potential
Read More...
Reward:Risk Ratio
Assessing a Trades Potential
When looking at a stock to buy, we look to various tools and techniques to help us assess the probability of its upward movement. However, will it go up is not the only question to ask - we also need to analyze the chart to see how far it is likely to go up and also how much of a loss we are willing to take to allow it to reach it's profit potential. The potential profit of a trade divided by the potential loss of trade is known as the Reward:Risk Ratio.
Read More...
Daily Market Commentary
Updated Monday, 9/18 for Tuesday's market
Winding Up...
Read More...
Updated Monday, 9/18 for Tuesday's market
| Key DOW Levels for 9/19 | |
| UP | Above 11,650 |
| DN | Below 11,525 |
Winding Up...
- Dow trades sideways throughout session, winds up within sloppy pattern. The index continues to trade within the boundaries of a fairly sloppy pattern as it continues to wind up for the next key move.
- The NASDAQ and S&P each sold off from the day's highs today, but continue to hold within the boundaries of the prior three day range. Look for continued range movement before the next key breakout is seen.
Summary
The Dow ended the day quietly today after moving lower from the day's highs. The index continues to hold beneath the 11,600 level and could be forming a bearish pattern at the highs, which could cause a test of the key lower trend line at 11,450. Watch 11,525 for direction tomorrow.
Read More...
Technical Indicators
Force Index
Read More...Developed by Dr. Alexander Elder, the Force Index combines price movements and volume to measure the market. Unmodified Force Index results can be rather erratic, better results are achieved by smoothing with an moving average. A 2-day exponential moving average of the Force Index may be used to track the strength of buyers and sellers in the short term while a 13-day exponential moving average better measures the strength of intermediate cycles.
If the Force Index is above zero Elder would say, "the bulls are in control." A negative Force Index would then signal that "the bears are in control." If the Index remains close to zero neither side has control and no strong trends exist.
The greater the distance from zero, the stronger the signal. If the Force Index flattens out it indicates that either volumes are falling or large volumes have failed to significantly move prices. Either situation is likely to precede a reversal.
.
Monday, September 18, 2006
Trading Ideas & Picks
Trading Ideas - Read More
From a technical standpoint, we have a new up trend. A normal up trend after such a strong down trend, like the one we had in the first part of the year, would only bring us up to the 1590 level. We did stop there, for a while, as expected, but then broke the resistance. This puts us in strange territory, the next resistance level is 1677. Basically, that means that the whole down trend is going to be undone by a new up trend...
Trading Ideas - Read More
Trading Ideas & Picks
Trading Picks - Read More
QQQQ: We've mentioned that an interesting inverse head and shoulders pattern had formed on the chart of the QQQQ. The past week's impressive gains were enough to send the price back above the neckline and we did indeed see a test of the 200 DMA like we were expecting...
Daily Stock Picks
Bottoming -
Sep 15 for Sep 18:
CKEC CRXX ESST SCKT
(Stocks making a 52 WK low but closing higher than they opened)
Oversold Stocks -
Sep 15 for Sep 18:
BTRX SYNM
(Stocks closing higher than they opened, crossing up through their 25 Stochastic level, and on 150% + greater than average 6 month volume)
Overreaction -
Sep 15 for Sep 18:
PGWC QRCP
(Potential Bullish Bounce: Stocks making a 52 WK low and moving down 10% or more in one day)
More... Stock Picks Page #1
NASDAQ Chart of the Day
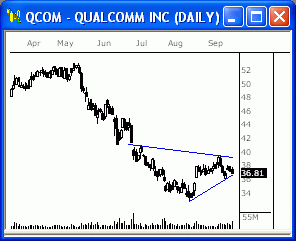
QCOM is winding up with a large triangle range and could be approaching a breakout very soon. Watch 36.50 down and 39.00 up for a potential breakout move.
Daily Trading Signals
QCOM is winding up with a large triangle range and could be approaching a breakout very soon. Watch 36.50 down and 39.00 up for a potential breakout move.
Daily Trading Signals
NYSE Chart of the Day

HET is winding up within a clear consolidation at the lows of the latest overall decline that began in May. The range is being broken to the upside at 64.00, which could finally send this stock higher back toward the 70.00 zone.
Daily Trading Signals
HET is winding up within a clear consolidation at the lows of the latest overall decline that began in May. The range is being broken to the upside at 64.00, which could finally send this stock higher back toward the 70.00 zone.
Daily Trading Signals
Daily Market Commentary
Updated Friday, 9/15 for Monday's market
Pop and Drop
Read More...
Updated Friday, 9/15 for Monday's market
| Key DOW Levels for 9/18 | |
| UP | Above 11,650 |
| DN | Below 11,500 |
Pop and Drop
- Dow rallies out of clear triangle, but pulls back from key 11,600 zone. The index fell about 36 points shy of our 11,650 target and eventually reversed from the day's highs to end the day with a 33 point gain.
- The NASDAQ and S&P each traded off the day's highs and look to be in the midst of forming bearish head-and-shoulders patterns. Look for a continued build-out of their respective patterns, a breakout could make for big movement ahead.
Summary
The Dow closed the day with a modest gain after pulling back from the day's opening blast higher. The index has been rejected by the 11,600 level and could look to regroup before another breakout attempt is seen. Watch for a light retracement early next week, unless 11,500 is broken. A violation of this level could make for much bigger selling.
Read More...
Trading Education Tutorial
Trading Ranges

Trading Ranges
Big Moves Occur Outside of the Range
Read More...
A trading range is basically a horizontal channel in which a security moves from the high and low of the channel for an extended amount of time. Obviously, the upper level of the range can be considered resistance and the lower level represents support. Trading within a range is possible, but it's the breakout from the range that provides the best opportunities.
Read More...
![]()