Friday, May 05, 2006
Trading Ideas & Picks
Consider Buying UnitedHealth Group Inc (NYSE: UNH)
Consider Buying UnitedHealth Group Inc (NYSE: UNH)
Keep a close eye on UNH. There is some support at 45, so when the stock reaches these levels it will be easier to tell what the future may holdo...
Trading Picks - Read More
Trading Ideas & Picks
Daytrading Qualcomm, Inc (NASDAQ: QCOM)
Daytrading Qualcomm, Inc (NASDAQ: QCOM)
A break through of the neck line at 52.35 would be a bullish sign for QCOM, but if the stock moves lower off the 52.35 resistance, I'm willing to bet that it will fill the small gap before moving higher...
Trading Ideas - Read More
Technical Indicators
Polarized Fractal Efficiency
Read More...Developed by Hans Hanula, the Polarized Fractal Efficiency indicator draws on Mandelbrot and fractal geometry to illustrate the efficiency of how pricing moves between two points over time. The more linear and efficient the price movement, the shorter the distance the prices must travel.
Use the PFE indicator to measure how trendy or congested the price action is. PFE readings above zero indicate that the trend is up and the higher the reading the "trendier" and more efficient the upward movement. PFE readings below zero mean that the trend is down. The lower the reading the "trendier" and more efficient the downward movement. Readings near zero indicate choppy, less efficient movement and a balance between supply and demand.
Use the PFE indicator to measure how trendy or congested the price action is. PFE readings above zero indicate that the trend is up and the higher the reading the "trendier" and more efficient the upward movement. PFE readings below zero mean that the trend is down. The lower the reading the "trendier" and more efficient the downward movement. Readings near zero indicate choppy, less efficient movement and a balance between supply and demand.
NASDAQ Chart of the Day

Daily Trading Signals
KOSP is winding up within a very clear triangle consolidation at the lows of the latest decline. Watch for a breakout from this range for the next big move: 50.00 up, and 44.75 down.
Daily Trading Signals
Daily Market Commentary
Updated Thursday, 5/4 for Friday's market
Winding Up...
Read More...
Updated Thursday, 5/4 for Friday's market
| Key DOW Levels for 5/5 | |
| UP | Above 11,475 |
| DN | Below 11,375 |
Winding Up...
- Dow breaks through key resistance, holds ground throughout session.
- NASDAQ got a solid upside reversal from support; as the S&P did likewise. Each index continues to hold within the boundaries of a key range, which we will continue to watch.
Summary
The Dow closed the day holding gains above key resistance at 11,425 today, which is positive heading into tomorrow's market. As long as the Dow can continue holding above the lower trend line at 11,385, continued strength should be seen. Otherwise, 11,385 could open the gates to a sizeable retracement.
Read More...
Thursday, May 04, 2006
Daily Stock Picks
Bottoming - AFFX AGEN ARIA ASTM CVTX DNDN DOVP FORD IDIX NHRX SFNT
(Stocks making a 52 WK low but closing higher than they opened)
Hard Slams - NPSP PDLI
(Price is more than 20% down; Volume is greater than Average for 6 Months)
Overreaction - CREAF GNSS NPSP
(Potential Bullish Bounce: Stocks making a 52 WK low and moving down 10% or more in one day)
More... Stock Picks Page #1
Trading Signals of the Day
Bullish Reversal Triggers
 Reversal bars are an objective technique used to time the entry of a trade. Read More... http://daily-stocks.netfirms.com/daily-trading-triggers.htm
Daily Market Commentary
Updated Wednesday, 5/3 for Thursday's market
Winding Up...
Read More...
Updated Wednesday, 5/3 for Thursday's market
| Key DOW Levels for 5/4 | |
| UP | Above 11,435 |
| DN | Below 11,360 |
Winding Up...
- Dow holds beneath major resistance, forms lower trend line to watch as well.
- NASDAQ tested support today, but held lows as the S&P reversed from support. Look to the NASDAQ for broader market direction upon a break or bounce at support.
Summary
The Dow closed the day slightly lower after trading sideways at the highs beneath key resistance. Look for the index to continue winding up between 11,360 and 11,425 before a big breakout occurs. Such a break should yield key movement.
Read More...
NASDAQ Chart of the Day

Daily Trading Signals
OATS is holding firmly at gap support at 16.75, which has held since February. The stock looks to be forming a bearish head-and-shoulders pattern, but direction will be dictated by movement from support at 16.75. Watch this zone closely.
Daily Trading Signals
Wednesday, May 03, 2006
Trading Ideas & Picks
Daytrading Microsoft Corp (NASDAQ: MSFT)
Daytrading Microsoft Corp (NASDAQ: MSFT)
The 2 day 2 minute bars chart above gives a snapshot of MSFT's trending as of late. The stock began down trending, then moved into an accelerated down trend. At the end of the trading session yesterday, MSFT was able to break out of the accelerated down trend, but still must pass through the resistance of the first down trend in order to break out of this funk...
Trading Ideas - Read More
Trading Ideas & Picks
Qualcomm, Inc (NASDAQ: QCOM) Looking Bullish
Qualcomm, Inc (NASDAQ: QCOM) Looking Bullish
QCOM has been trending up for quite some time now. The 6 month daily bars chart above shows a pull back to the trend line, presenting a bullish scenario for QCOM. The pull back occurred on average volume, which does not present any red flags for a continued downside move...
Trading Picks - Read More
Technical Indicators
Rate of Change
Read More...The Rate of Change is an oscillator that displays the difference between the current price and the price x-time periods ago. As prices increase, the ROC rises and as prices fall, the ROC falls. The greater the change in prices, the greater the change in the ROC.
The 10-day ROC is an excellent short- to intermediate-term overbought/oversold indicator. The higher the ROC, the more overbought the security; when the ROC falls expect a rally. As with all overbought/over-sold indicators, watching for the market to start its correction before placing a trade. Often extremely overbought/oversold readings usually imply a continuation of the current trend and any overbought market may remain that way for some time.
The 10-day ROC is an excellent short- to intermediate-term overbought/oversold indicator. The higher the ROC, the more overbought the security; when the ROC falls expect a rally. As with all overbought/over-sold indicators, watching for the market to start its correction before placing a trade. Often extremely overbought/oversold readings usually imply a continuation of the current trend and any overbought market may remain that way for some time.
NASDAQ Chart of the Day
Daily Trading Signals
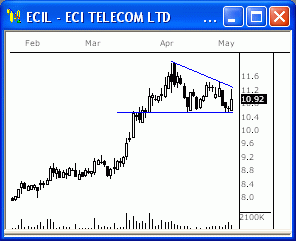
ECIL has formed a clear triangle consolidation at the highs of the latest advance. A breakout from this consolidation could be big. Watch 11.45 up, and 10.50 down for movement.
Daily Trading Signals
Daily Market Commentary
Updated Tuesday, 5/2 for Wednesday's market
Updated Tuesday, 5/2 for Wednesday's market
| Key DOW Levels for 5/3 | |
| UP | Above 11,435 |
| DN | Below 11,325 |
Sharp Reversal
- Dow trades sideways beneath key resistance, sells off late in the day.
- NASDAQ and S&P each rose from yesterday's lows, as the NASDAQ continues to honor key support. Watch today's upper range for an indication of continued strength tomorrow.
Summary
The Dow closed the day at the highs of the session and continues to honor the razor sharp 11,425 resistance level. This level is the major fulcrum in the charts across timeframes that will determine major market direction. Keep a close eye on this zone.
Read More...
Tuesday, May 02, 2006
Trading Ideas & Picks
Triangle Breakout
Q broke out of a bullish triangle and rose dramatically on high volume. The MACD and MACD Slope are both bullish...
Trading Ideas - Read More
Q broke out of a bullish triangle and rose dramatically on high volume. The MACD and MACD Slope are both bullish...
Trading Ideas - Read More
Trading Ideas & Picks
AAPL - Next Solid Buy Point
Next solid buy point for this tired old big winner from last year is when it gets over the horizontal trendline in the chart at $72...
Trading Ideas - Read More
Next solid buy point for this tired old big winner from last year is when it gets over the horizontal trendline in the chart at $72...
Trading Ideas - Read More
Technical Indicators
Fisher Transform
The Fisher Transform indicator attempts to be a major turning point indicator and is based on John Ehlers' November 2002 Stocks and Commodities Magazine article, "Using The Fisher Transform."
With distinct turning points and a rapid response time, the Fisher Transform uses the assumption that while prices do not have a normal or Gaussian probability density function (that familiar bell-shaped curve), you can create a nearly Gaussian probability density function by normalizing price (or an indicator such as RSI) and applying the Fisher Transform. Use the resulting peak swings to clearly identify price reversals.
Read More...The Fisher Transform indicator attempts to be a major turning point indicator and is based on John Ehlers' November 2002 Stocks and Commodities Magazine article, "Using The Fisher Transform."
With distinct turning points and a rapid response time, the Fisher Transform uses the assumption that while prices do not have a normal or Gaussian probability density function (that familiar bell-shaped curve), you can create a nearly Gaussian probability density function by normalizing price (or an indicator such as RSI) and applying the Fisher Transform. Use the resulting peak swings to clearly identify price reversals.
Daily Market Commentary
Updated Monday, 5/1 for Tuesday's market
Updated Monday, 5/1 for Tuesday's market
| Key DOW Levels for 5/2 | |
| UP | Above 11,425 |
| DN | Below 11,250 |
Late-Day Decline
- Dow trades sideways beneath key resistance, sells off late in the day.
- NASDAQ NASDAQ and S&P each closed quiet sessions with a big late-day sell-off, which is concerning heading into tomorrow's market. Keep an eye on support, as this level will tell us if further selling is on the horizon.
Summary
The Dow closed the day lower after failing to break above the major 11,425 resistance level. The index continues to trade within the boundaries of the clear range that has formed from 11,250 and 11,425. Look for continued range movement in this zone ahead of the next major breakout move.
Read More...
NASDAQ Chart of the Day
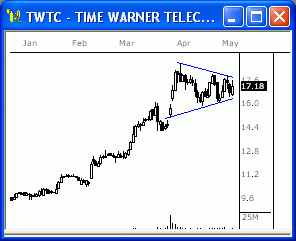
TWTC continues to hold at the highs after rallying throughout the beginning of the year. The consolidation spans from 16.00 to 18.00 and will likely yield key movement upon a breakout.
Daily Trading Signals
Daily Trading Signals
Monday, May 01, 2006
Trading Ideas & Picks
Day Trading KLA-Tencor Corp (NASDAQ: KLAC)
KLAC has been trading relatively weak to the market as of late. the weakness could continue, but it will have to pass through support at 48 first. If KLAC is able to make its way through 48, it will likely continue lower...
Trading Ideas - Read More
Will Amazon.com inc (NASDAQ: AMZN) Withstand Support?
AMZN has not been performing well for quite some time now. It closed at 35.21 on Friday, which presents a good opportunity to place a support based trade on AMZN...
Trading Ideas - Read More
Daily Stock Picks
Bottoming - ALLI CYBX DELL DRYS HTCH MRGE PXLW TOPT UFCS
(Stocks making a 52 WK low but closing higher than they opened)
Hard Slams - ANCC HILL MTSX OCPI
(Price is more than 20% down; Volume is greater than Average for 6 Months)
Overreaction - HILL MSFT
(Potential Bullish Bounce: Stocks making a 52 WK low and moving down 10% or more in one day)
More... Stock Picks Page #1
Daily Market Commentary
Updated Friday, 4/28 for Monday's market
Another Volatile Session
Updated Friday, 4/28 for Monday's market
| Key DOW Levels for 5/1 | |
| UP | Above 11,425 |
| DN | Below 11,250 |
Another Volatile Session
- Dow rallies sharply from early lows, but trades back to lows in volatile session.
- NASDAQ lagged the broader market today, as the Dow and S&P each ran higher early in the session. Eventually, all indexes pushed lower after topping out early in the day, leaving them beneath key upper lines for Monday's market.
Summary
The Dow closed another volatile session lower today, as the index ran into resistance at 11,400 yet again. Look for the index to continue to struggle in this zone ahead of the next key move. Further range movement is likely between 11,250 and 11,425 before decisive movement will be seen.
Read More...
NASDAQ Chart of the Day
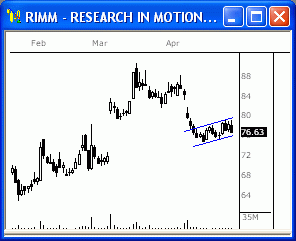
RIMM has formed a bearish sloping consolidation after dropping early in April. This is a very bearish sign that could lead to big weakness ahead. Watch 76.00 for a downside break.
Daily Trading Signals
Daily Trading Signals
![]()