Saturday, June 24, 2006
NASDAQ Chart of the Day

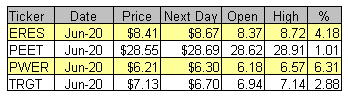
Daily Trading Signals
CRZO is winding up within the boundaries of a very large triangle range, which is gearing up for a huge breakout. Watch 26.00 down, and 31.00 up for the next big trend.
Daily Trading Signals
NYSE Chart of the Day

Daily Trading Signals
TKR is getting an upside reversal from a clear lower trend line. The index is also forming a bullish inverted head-and-shoulders pattern, which will likely help to spark continued strength back toward resistance at 36.00. Watch 32.00 for a breakout.
Daily Trading Signals
Technical Indicators
Fibonacci Retracements
Read More...Fibonacci Retracements are displayed by first drawing a trendline between two extreme points, i.e. a trough and opposing peak. A series of horizontal lines are drawn intersecting the trendline at the Fibonacci levels.
After a significant price move in either up or down direction, prices will often give back a significant portion (if not all) of the original move. As prices retrace, look for support and resistance levels often occurring at or near the Fibonacci Retracement levels.
After a significant price move in either up or down direction, prices will often give back a significant portion (if not all) of the original move. As prices retrace, look for support and resistance levels often occurring at or near the Fibonacci Retracement levels.
Daily Market Commentary
Updated Thursday, 6/22 for Friday's market
Steady Decline
Read More...
Updated Thursday, 6/22 for Friday's market
| Key DOW Levels for 6/23 | |
| UP | Above 11,150 |
| DN | Below 10,975 |
Steady Decline
- Dow pulls back from recent highs, holds at 11,000 zone.
- The S&P and NASDAQ each sold off early in the day and are now holding at lows above key lower trend lines. Key in on these lines, as they could provide nice movement tomorrow.
Summary
The Dow closed the day with a slow decline today, but continues to hold above the key 10,900 support level, which is the clear fulcrum in the charts at this point. Look for continued overall strength above this zone tomorrow; unless a solid break takes it out.
Thursday, June 22, 2006
Trading Signals of the Day
Bullish Reversal Triggers
Reversal bars are an objective technique used to time the entry of a trade. Read More...
http://daily-stocks.netfirms.com/daily-trading-triggers.htm
http://daily-stocks.netfirms.com/daily-trading-triggers.htm
NYSE Chart of the Day

Daily Trading Signals
FDX has gotten a solid breakout from a tight triangle consolidation at 112.00. Look for continued strength back toward resistance at 120.00.
Daily Trading Signals
NASDAQ Chart of the Day
Daily Trading Signals
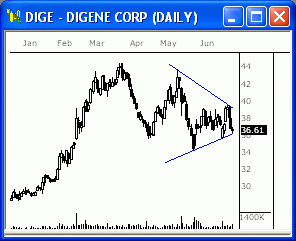
DIGE is winding up within a very large triangle consolidation that has formed at the highs of the steady uptrend. A breakout from this consolidation could be huge. Watch 40.00 up, and 36.00 down.
Daily Trading Signals
Visual Trader
Get Ahead Of The Game - With VisualTrader you will know when the market is turning, which industry groups are leading the stampede, and which charts have the best setups. And, not only will you see the right opportunity, you see it as it is just beginning to form - ahead of the pack. VisualTrader shows you dynamics like volatility breakouts across the entire map..
OmniTrader
Read More...
OmniTrader is designed to help you Trade the Moves. By automating technical analysis, OmniTrader gives you the power to make decisions fast! No other software gives you real trading signals with all of the supporting information automatically displayed for you. OmniTrader's signals are exceptionally accurate - making it a Great Prospecting Tool.
120 Trading Systems
OmniTrader has 120 built-in trading systems (daily and weekly) which are automatically run each time "To Do" list is executed.
120 Trading Systems
OmniTrader has 120 built-in trading systems (daily and weekly) which are automatically run each time "To Do" list is executed.
Read More...
Daily Market Commentary
Updated Wednesday, 6/21 for Thursday's market
Solid Advance
Read More...
Updated Wednesday, 6/21 for Thursday's market
| Key DOW Levels for 6/22 | |
| UP | Above 11,150 |
| DN | Below 10,900 |
Solid Advance
- Dow breaks consolidation to upside, rallies throughout the day.
- The S&P and NASDAQ each got solid upside moves today, which could translate into much bigger moves ahead. Keep an eye on the clear upper trend lines tomorrow, as a break could be huge for direction.
Summary
The Dow ended the day with a late-day decline, but continues to hold above the major upper trend line, which indicates a sense of bullishness not seen in quite a while. If the index can continue to hold above 10,900, continued overall strength should be seen.
Wednesday, June 21, 2006
Trading Ideas & Picks
Based on our analysis of the company's strategic positioning, management, corporate governance, risk exposures and operations, we believe that RCKY is undervalued. Our analysis is supported by positive valuation signals from informed investors. There are weak catalysts for stock price appreciation...
Trading Ideas - Read More
Trading Ideas & Picks
DOX has risen strongly during the past four days on high volume and with bullish stochastics crossover in oversold territory...
Trading Picks - Read More
DOX has risen strongly during the past four days on high volume and with bullish stochastics crossover in oversold territory...
Daily Market Commentary
Updated Tuesday, 6/20 for Wednesday's market
Holding...
Read More...
Updated Tuesday, 6/20 for Wednesday's market
| Key DOW Levels for 6/20 | |
| UP | Above 11,025 |
| DN | Below 10,900 |
Holding...
- Dow ends session with a gain, forms clear consolidation range at highs.
- The S&P and NASDAQ each traded mostly sideways-to-down today, but continue to hold near the overall highs of the latest advance. An upside break from their respective ranges could fire up another solid advance soon.
Summary
The Dow closed a fairly indecisive session higher today, and continues to hold within the boundaries of a potentially bullish consolidation. A breakout from this range could be big for medium term movement.
NASDAQ Chart of the Day

Daily Trading Signals
CTHR has formed a clear consolidation at the lows of a very steady decline. The consolidation spans from 9.60 to 12.00. Watch this range closely for the next big breakout move.
Daily Trading Signals
NYSE Chart of the Day
Daily Trading Signals
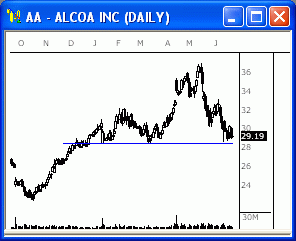
AA is holding at major support at 28.40, which has held firmly since last December. The stock is currently sitting just above support and could get either a big break or bounce off this level. Watch it closely for the next key move.
Daily Trading Signals
Technical Indicators
Ehlers' Fisher Transform
Read More...The Fisher Transform indicator attempts to be a major turning point indicator and is based on John Ehlers' November 2002 Stocks and Commodities Magazine article, "Using The Fisher Transform."
With distinct turning points and a rapid response time, the Fisher Transform uses the assumption that while prices do not have a normal or Gaussian probability density function (that familiar bell-shaped curve), you can create a nearly Gaussian probability density function by normalizing price (or an indicator such as RSI) and applying the Fisher Transform. Use the resulting peak swings to clearly identify price reversals.
With distinct turning points and a rapid response time, the Fisher Transform uses the assumption that while prices do not have a normal or Gaussian probability density function (that familiar bell-shaped curve), you can create a nearly Gaussian probability density function by normalizing price (or an indicator such as RSI) and applying the Fisher Transform. Use the resulting peak swings to clearly identify price reversals.
Tuesday, June 20, 2006
NASDAQ Chart of the Day

Daily Trading Signals
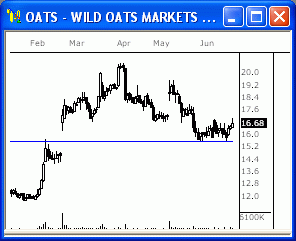
OATS is holding firmly at key gap support at 15.50. Watch this zone closely for a key break or bounce.
Daily Trading Signals
NYSE Chart of the Day

Daily Trading Signals
AYE is testing a clear lower trend line at 35.00. This stock has remained very strong, but a break of this line at 35.00 could lead to heavy selling.
Daily Trading Signals
Daily Market Commentary
Updated Monday, 6/19 for Tuesday's market
Steady Weakness
Read More...
Updated Monday, 6/19 for Tuesday's market
| Key DOW Levels for 6/19 | |
| UP | Above 11,075 |
| DN | Below 10,900 |
Steady Weakness
- Dow reverses from upper trend line, ends session lower.
- The S&P and NASDAQ each dragged lower from their respective highs today and continue to hold beneath key upper lines. Watch for continued range movement tomorrow, as the indexes gear up for the next big move.
Summary
The Dow ended the day lower after reversing down from the major upper trend line at 11,050. The is now holding ground between 10,900 and 11,050 just beneath the upper trend line. A breakout from this range will likely influence key market direction.
Monday, June 19, 2006
Daily Market Commentary
Updated Friday, 6/16 for Monday's market
Holding..
Read More...
Updated Friday, 6/16 for Monday's market
| Key DOW Levels for 6/19 | |
| UP | Above 11,050 |
| DN | Below 10,950 |
Holding..
- Dow trades sideways throughout session, holds yesterday's big gains.
- The S&P and NASDAQ each traded mostly sideways throughout the session today, as each gears up for the next big move. Watch the tight consolidation boundaries for entry opportunities Monday.
Summary
The Dow closed the day quietly within the boundaries of a tight consolidation, which we will watch closely for Monday's market. The fact that the consolidation has formed right at the upper trend line indicates that a big break or bounce could be ahead. Watch this line closely next week.
NASDAQ Chart of the Day

Daily Trading Signals
ATML is holding at major support at 4.22. Continue to watch this support level for a possible bounce opportunity.
Daily Trading Signals
NYSE Chart of the Day
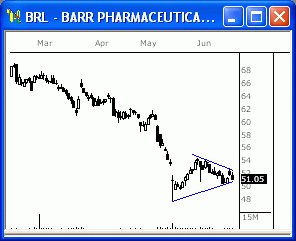
BRL has formed a clear triangle consolidation at the lows of the overall decline, which is fairly bearish. A breakout in either direction from this consolidation should yield big movement. Watch 52.50 up, and 50.50 down.
Daily Trading Signals
BRL has formed a clear triangle consolidation at the lows of the overall decline, which is fairly bearish. A breakout in either direction from this consolidation should yield big movement. Watch 52.50 up, and 50.50 down.
Daily Trading Signals
![]()