Saturday, October 28, 2006
Trading Signals of the Day


Reversal bars are an objective technique used to time the entry of a trade. Read More... http://daily-stocks.netfirms.com/daily-trading-triggers.htm
Friday, October 27, 2006
The Big W
This rally fades and price descends back toward a test of the last bottom low. At this moment the trader listens closely for the first bell to ring. A wide range reversal bar (doji or hammer) may appear close to the low price of the last bottom. Or volume spikes sharply but price does not fail. Better yet, a Turtle Reversal develops where price violates the last low by a few ticks and then prints a sharp move back above support. Should any or all of these events occur, we mark the potential second leg on our Big W. Read More...

Daily Trading Signals

HXL has gotten a huge breakout from the large consolidation range at 15.50 via a nice breakaway gap, which is very bullish. Look for more strength from this stock.
Daily Trading Signals
Support and Resistance Levels

History Tells Us When Securites are Overbought or Oversold
Support indicates a level on the chart where we can expect an increase in the demand for a security (buyers take over). How do we know this? By identifying this reaction to this price level in the chart's history.
Read More...
Updated Thursday, 10/26 for Friday's market.
| Key DOW Levels for 10/27 | |
| UP | Above 12,200 |
| DN | Below 12,075 |
New Highs...
- The NASDAQ continues lead the broader market higher and the S&P continues to follow suit. Look for continued strength above near-term support.
Summary
The Dow ended the day with a modest gain, but held its ground despite a huge sell-off to begin the day. The index will continue to push steadily higher within the current uptrend, unless 12,100 is solidly violated.
Read More...
Thursday, October 26, 2006
|
Bottoms print as a result of market physics. Uptrends and downtrends exhibit natural wave motion as they thrust forward, and they pull back to test gains or losses. This action-reaction becomes very important at market turning points. It implies that a reversal pattern will appear at some point in each trend. In an uptrend, a lower high will eventually follow a higher high and mark a new top. In a downtrend, lower lows will finally stop when price action prints a higher low. This marks the birth of a bottom. Read More...
Measured and Exhaustion Gaps

Identifiable Patterns After Confirmation Move
We have previously mentioned the three types of gaps that are of relevance to investors - the breakaway gap, the measured (or continuation) gap, and the exhaustion gap. We previously discussed the breakaway gap, but it is important to discuss the measured gap and exhaustion gap at the same time. Why? Because it is difficult to tell one from the other until after the fact.
Read More...

Daily Trading Signals

Daily Trading Signals
Updated Wednesday, 10/25 for Thursday's market.
| Key DOW Levels for 10/26 | |
| UP | Above 12,150 |
| DN | Below 12,050 |
Still Holding...
- The NASDAQ continues to wind up within a large triangle pattern, while the S&P continues to push higher. Look for continued overall strength, unless support is violated.
Summary
The Dow continues to trade within the boundaries of a clear consolidation that should spark the next key move. Watch the boundaries of this pattern for big movement..
Read More...
Wednesday, October 25, 2006
Island Reversals
Stand Alone Formation Speaks Volumes
Reversals tend to occur slowly, with securities forming double bottoms, higher lows, head and shoulders patterns, etc. before starting a new trend. However, sometimes we see a dramatic reversal immediately, and one of the best indications of these types of reversals is Island Tops and Bottoms.
Read More...

Daily Trading Signals
Daily Trading Signals
Updated Tuesday, 10/24 for Wednesday's market.
| Key DOW Levels for 10/25 | |
| UP | Above 12,150 |
| DN | Below 12,000 |
Consolidating...
- The NASDAQ continues to wind up within the boundaries of a large triangle pattern, while the S&P remains within a very tight consolidation. A breakout from either of these patterns will spark nice movement tomorrow.
Summary
The Dow continues to hold at the overall highs within the boundaries of a tight consolidation. Look for continued range movement ahead of the next key breakout move from this range.
Read More...
Tuesday, October 24, 2006
Bottoming -
Oct 23 for July 24:
RDYN UFPI WTFC
(Stocks making a 52 WK low but closing higher than they opened)
Oversold Stocks -
Oct 23 for July 24:
BPOP COMS CTDC FLML NVLS PSUN UCTT
(Stocks closing higher than they opened, crossing up through their 25 Stochastic level, and on 150% + greater than average 6 month volume)
Overreaction -
Oct 23 for July 24:
RDYN
(Potential Bullish Bounce: Stocks making a 52 WK low and moving down 10% or more in one day)
More... Stock Picks Page #1
Quantum Swing Trader
Exclusive Preview
Trading Tools
Get Ahead of the Game
Selection of trading software and trading services that can help you trade better. Find which stocks or options to trade and get accurate Buy/Sell/Sell Short signals to enter and exit trading positions in a timely manner. Whether you are a beginner or an experienced trader this products will be able to help you maximize your potential and returns.
Bottoming -
Oct 20 for Oct 23:
SCKT SFUN
(Stocks making a 52 WK low but closing higher than they opened)
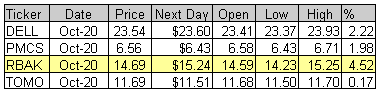
Oversold Stocks -
Oct 20 for Oct 23:
ASML RBAK
(Stocks closing higher than they opened, crossing up through their 25 Stochastic level, and on 150% + greater than average 6 month volume)
Overreaction -
Oct 20 for Oct 23:
GHM STMP
(Potential Bullish Bounce: Stocks making a 52 WK low and moving down 10% or more in one day)
More... Stock Picks Page #1
Trading Signals of the Day

 Reversal bars are an objective technique used to time the entry of a trade. Read More... http://daily-stocks.netfirms.com/daily-trading-triggers.htm
Trading Tools
Shogun Trading's approach can benefit all stock traders, from day traders to long term swing traders. We are proud to show some of the best Performance in Day Trading, Longer Term Swing Trading Strategy, Systemized Swing Trading and through our Educational Courses and Videos... » Get More Info Now!
Daily Trading Signals
The parallel lines represent a measurement of two Standard Deviations from the mean and are assigned a value of zero and 100 on the chart. The indicator represents the price as it travels above and below the mean (50%) and outside the two standard deviations (zero and 100). Penetration of the upper band represents overbought conditions while penetration of the lower band signifies oversold conditions.
Usage of the CCT Bollinger Band Oscillator to identify "failure swings" and "divergences" can lead to significant reversals...
Daily Trading Signals
Consolidations

Sideways Movement Gives Indication of Future Price Direction
A consolidation is a place where buyers and sellers are very closely matched in numbers. As the battle ensues, others notice that the market is consolidating, and begin considering to get on board. As soon as a break from the consolidation occurs, the latent buyers or sellers usually begin taking positions.
Read More...
Updated Monday, 10/23 for Tuesday's market.
| Key DOW Levels for 10/24 | |
| UP | Above 12,150 |
| DN | Below 12,000 |
Steady Rally...
- The NASDAQ and S&P each rallied solidly to begin the day. Look for continued overall strength, unless key near-term support levels are violated.
Summary
The Dow closed the day at the highs of the session after rallying big to begin the day. The index is now holding at the highs of the session and could build out the tight consolidation for another rally soon. Watch for continued strength, unless 12,050 is violated.
Read More...

Daily Trading Signals

VFC took a large gap up this morning and immediately filled it to the downside en route to heavy selling to the Close. This behavior is highly bearish and could spark much more additional selling. Watch 74.00 for a trend line break to indicate another wave of declines.
Daily Trading Signals
Saucer Patterns

Rare Pattern Is One of the Most Predictive
One of the most predicitive chart patterns you will come across is the saucer pattern. Saucers are also referred to as "bowls" or even "rounded tops or bottoms", and one look at this pattern tells where these names are derived from. However, there is a problem with saucer patterns - they're hard to find.
Read More...
Updated Friday, 10/20 for Monday's market.
| Key DOW Levels for 10/23 | |
| UP | Above 12,050 |
| DN | Below 11,940 |
Still Holding...
- The NASDAQ and S&P each traded mostly sideways-to-up after the early weakness. Each continues to hang within their respective ranges, which could be on the verge of a big breakout opportunity.
Summary
The Dow closed the day with a 9 point loss and continues to struggle in the 12,000 zone. The index has maintained a highly bullish stance within a clear uptrend, but a huge violation through 11,950 could spark big weakness.
Read More...
![]()