Friday, July 28, 2006
Daily Market Commentary
Updated Thursday, 7/27 for Friday's market
Mid-Day Decline
Read More...
Updated Thursday, 7/27 for Friday's market
| Key DOW Levels for 7/28 | |
| UP | Above 11,200 |
| DN | Below 11,050 |
Mid-Day Decline
- Dow sells off from early highs, drops back to key 11,100 level. The index closed the day with a 2 point loss, but could be gearing up for a much steeper decline.
- The NASDAQ and S&P each sold off from early highs today and continue to be rejected by resistance. Today's decline could be the beginning of much more selling ahead.
Summary
The Dow closed the day with a small loss today and is showing a reluctance to break through the top of the large range at 11,200. Watch 11,050 for early signs of weakness tomorrow, unless 11,200 is solidly crossed.
Read More...
Trading Education Tutorial
Time Trading
Read More...
Time Trading
Sophisticated technical indicators evolve from simple data inputs of price and time. While most traders understand how price patterns reveal hidden opportunity, many fail to comprehend how time impacts both tactics and results. Lacking a skilled understanding of opportunity cost, they misinterpret signals and waste valuable resources. Or, trapped in common trend relativity errors, they prepare trades in one time frame but execute them in another.
Opportunity cost defines how the trader manipulates working capital. For example, this important concept reveals why cutting losses efficiently is so important for long term survival. By its nature, taking any stock position dictates that those funds will not be available for another trade. This becomes a critical issue on account drawdowns when individual trades can dictate success or failure for the aspirant.
All trends in the markets are time frame specific. For example, the existence of an uptrend in a daily chart says nothing about the trend in the monthly or intraday chart. This highlights the importance of correct time input in preparing technical indicators or reading chart patterns. When improperly time-tuned, technical analysis loses its effectiveness. Alternatively, resonant time readings will evoke startling accuracy with otherwise mediocre data input..
Read More...
Thursday, July 27, 2006
NASDAQ Chart of the Day

Daily Trading Signals
CONR is getting the initial upside break through the top of the large triangle range, which is highly bullish. Watch for follow-through above 28.50 for continued strength.
Daily Trading Signals
NYSE Chart of the Day
Daily Trading Signals
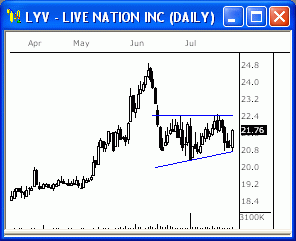
LYV is consolidating within the boundaries of a clear range from 20.75 to 22.50. Watch for a breakout from this range for solid movement.
Daily Trading Signals
Daily Market Commentary
Updated Wednesday, 7/26 for Thursday's market
Steady Advance
Read More...
Updated Wednesday, 7/26 for Thursday's market
| Key DOW Levels for 7/27 | |
| UP | Above 11,175 |
| DN | Below 11,025 |
Steady Advance
- Dow pushes slowly higher from early lows, tests key 11,150 level. The index smacked into the key 11,150 resistance level and dropped to the close for a 1 point loss. Watch 11,150 closely for key direction..
- The NASDAQ and S&Peach rallied from early lows to test resistance today, but failed to break out. Watch resistance tomorrow for a break or bounce.
Summary
The Dow ended the day basically flat after testing critical resistance at 11,150 today, but could get another crack at this level tomorrow. Watch 11,175 for a potential breakout and 11,025 for early signs of key weakness.
Trading Education Tutorial
Double Tops and Bottoms
Waiting for the Setup to Complete Results in Profits
Read More...
Double Tops and Bottoms
Waiting for the Setup to Complete Results in Profits
There are various chart patterns that help us find good reversal candidates. Of the major reversal patterns, the double top or bottom is not only one of the most recognizable, but also one of the most predictive...
Read More...
Wednesday, July 26, 2006
Profits Run
Instant Profits
Quantum Swing Trader - Profit Pulling Swing Trading Principles
Read More..."Instant Profits" - Step-By-Step Trading Course. Get the first 5 Chapters of this groundbreaking trading course, FOR FREE!
Super Divergence BlueprintDiscover Hidden Trades With Astonishing Simplicity. Hurry, Get Your Free "Sneak Preview" Of "Profits Run" Trading "Blueprint".
Stock Trading Advisory Service
Daily Stock Trading Recommendations That Tell You Exactly Which Stocks To Buy & Sell... Try it for 30 days for just $1!Quantum Swing Trader - Profit Pulling Swing Trading Principles
Trading Education Tutorial
Saucer Patterns

Rare Pattern Is One of the Most Predictive
Read More...
Saucer Patterns
Rare Pattern Is One of the Most Predictive
One of the most predicitive chart patterns you will come across is the saucer pattern. Saucers are also referred to as "bowls" or even "rounded tops or bottoms", and one look at this pattern tells where these names are derived from. However, there is a problem with saucer patterns - they're hard to find...
Read More...
Technical Indicators
Linear Regression Indicator
Read More...The Linear Regression Indicator plots the trend of a security's price over time. That trend is determined by calculating a Linear Regression Trendline using the least squares method. This ensures the minimum distance between the data points and a Linear Regression Trendline.
Unlike the straight Linear Regression Trendline, the Linear Regression indicator plots the ending values of multiple Linear Regression trendlines. Any point along the Linear Regression Indicator will be equal to the ending value of a Linear Regression Trendline, but the result looks more like a Moving Average...
Unlike the straight Linear Regression Trendline, the Linear Regression indicator plots the ending values of multiple Linear Regression trendlines. Any point along the Linear Regression Indicator will be equal to the ending value of a Linear Regression Trendline, but the result looks more like a Moving Average...
NASDAQ Chart of the Day
Daily Trading Signals
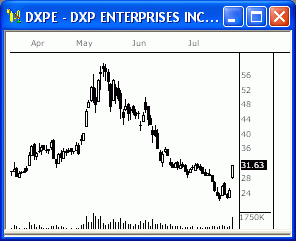
DXPE has gotten a solid breakaway gap to the upside on increased volume, which is highly bullish. Watch for continued upside movement from this stock.
Daily Trading Signals
NYSE Chart of the Day

Daily Trading Signals
FBN is getting a solid upside break through a clear upper trend line at 20.00 which is very bullish. If the index can remain above 20.00, we could see a nice follow-through to the upside.
Daily Trading Signals
Daily Market Commentary
Updated Tuesday, 7/25 for Wednesday's market
Late-Day Rally
Read More...
Updated Tuesday, 7/25 for Wednesday's market
| Key DOW Levels for 7/26 | |
| UP | Above 11,150 |
| DN | Below 11,000 |
Late-Day Rally
- Dow winds up throughout session, rallies big late in the afternoon. The index wound up within a tight triangle range and eventually got a huge upside break that led to a steady rally to the Close, enough for a nice 53 point gain. Continue to watch the major upper trend line for medium term direction.
- The NASDAQ and S&P each rallied solidly to the Close to end the day in bullish fashion. If the indexes can remain above near-term support, we could see big strength ahead. Otherwise, a violation of these support levels will open the door to more selling.
Summary
The Dow closed the day with a solid rally after winding up throughout the session today. The index is now testing a major upper trend line that could tell the story for the next key medium term move in this index. Watch 11,150 and 11,000 for big directional movement.
Trading Tools
Shogun Swing Trading - Best Swing Trading:
Shogun Trading's approach can benefit all stock traders, from day traders to long term swing traders. We are proud to show some of the best Performance in Day Trading, Longer Term Swing Trading Strategy, Systemized Swing Trading and through our Educational Courses and Videos... » Get More Info Now!
Shogun Trading's approach can benefit all stock traders, from day traders to long term swing traders. We are proud to show some of the best Performance in Day Trading, Longer Term Swing Trading Strategy, Systemized Swing Trading and through our Educational Courses and Videos... » Get More Info Now!
Tuesday, July 25, 2006
NASDAQ Chart of the Day

Daily Trading Signals
IKAN is holding at key support at 12.00, which has held since last December. Watch for a break or bounce in this zone for key long term direction.
Daily Trading Signals
NYSE Chart of the Day
Daily Trading Signals
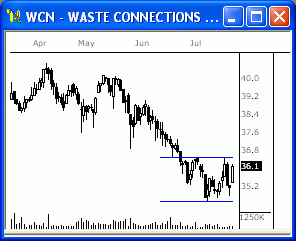
WCN is holding within the boundaries of a tight consolidation from 34.55 to 36.48. A breakout from this range could spark a nice move over the course of the next month. Watch this range closely.
Daily Trading Signals
| Recent Picks / Trading Ideas |
| Bullish Fundamental Catalysts July 24 LAUR: The stock rose strongly and on high volume following an earnings announcement, it broke out of a descending channel. Also several catalysts for short-term price appreciation exist ... |
| Weekly Market Update July 24 1450 is now support level. Break below it - will stay on the short side. If the market breaks the 1500 resistance, this may be the end of the long term down trend ... |
| Bullish Stochastics, Volume and Price Movement July 20 The entire homebuilding sector has been under siege for months; BZH, like most homebuilders, is now showing signs that a short-term reversal may occur ... |
| Bull Flag July 17 Despite a weak market, WOOF has been performing quite well; the stock is up over 25% from June lows; Volume has followed the stock up and down ... |
| Trading Ideas for today July 17 Stock Picks - Daily Long (COP SLB MHL RSH) and Short (UVN HXL) Potential Swing Candidates ... |
| Bull Flag July 11 JBLU rose more than 30% from late April until late June; since then, it has been consolidating in a bull flag formation. A breakout would be bullish ... |
Technical Indicators
Directional Momentum Indicator
Read More...The Directional Momentum Indicator is an attempt to quantify the trending or directional behavior of a market. It helps identify trends and whether or not price is moving quickly enough to be worth a long or short play.
+DI and -DI are components in the calculation of the ADX (Average Directional Movement) and ADXR (Directional Movement Rating) indicators. Perhaps the best way to think of the +DI is as a measure of the percentage of upwards movement. When the +DI value is greater than the -DI, a long position is indicated...
+DI and -DI are components in the calculation of the ADX (Average Directional Movement) and ADXR (Directional Movement Rating) indicators. Perhaps the best way to think of the +DI is as a measure of the percentage of upwards movement. When the +DI value is greater than the -DI, a long position is indicated...
Trading Education Tutorial
Breakaway Gaps

Pressure Helps Identify Movers
Read More...
Breakaway Gaps
Pressure Helps Identify Movers
Gaps occur when there is a dramatic change in market conditions. They can occur at the beginning of a trading session (i.e. most NASDAQ stocks) or even during the session itself. There are three types of gaps that are of interest to us when we analyze charts: breakaway, measured (also known as continuation) and exhaustion gaps. Today we will discuss the breakaway gap...
Read More...
Daily Market Commentary
Updated Monday, 7/24 for Tuesday's market
Solid Advance
Read More...
Updated Monday, 7/24 for Tuesday's market
| Key DOW Levels for 7/24 | |
| UP | Above 11,100 |
| DN | Below 10,900 |
Solid Advance
- Dow breaks consolidation to upside, rallies to the Close. The index rallied through 11,000 to 11,050 and is now holding just beneath a major upper trend line that will be key to watch for medium term direction.
- The NASDAQ and S&P each blasted off right from the Open today and continue to maintain bullish momentum. Watch lower trend lines for early signs of weakness.
Summary
The Dow closed the day near the highs of the session after rocketing out of the tight consolidation at the Open. The index is now approaching a major upper trend line that could be a huge influence to future direction. Watch it closely.
Monday, July 24, 2006
Daily Stock Picks
Bottoming -
July 21 for July 24:
ACAD APOL CAKE CBRL CHKP CNET CODI CPKI CTAS DELL DISCA ELNK GEPT HTCH IRBT JRCC KOPN KSWS MCHX MEAD MEDI MNTA MVIS NPSP OSTK PLSB PRTR PTMK SWKS THOR TRMS TXRH VION YHOO I
(Stocks making a 52 WK low but closing higher than they opened)
Oversold Stocks -
July 21 for July 24:
CGPI HTCH LTXX
(Stocks closing higher than they opened, crossing up through their 25 Stochastic level, and on 150% + greater than average 6 month volume)
Overreaction -
July 21 for July 24:
BRCM DEPO EGLT HOKU HTCH IPIX IUSA NSIT PDFS PMCS UPFC ZHNE
(Potential Bullish Bounce: Stocks making a 52 WK low and moving down 10% or more in one day)
More... Stock Picks Page #1
NASDAQ Chart of the Day

Daily Trading Signals
LAUR has gotten a huge breakaway gap to the upside on big volume and could be headed much higher. Look for continued overall strength from this stock.
Daily Trading Signals
Technical Indicators
Ease of Movement
Read More...TEase of Movement Indicator was designed to illustrate the relationship between volume and price change. It shows how much volume is required to move prices.
High Ease of Movement values occur when prices are moving upward with light volume. Low values occur when prices are moving downward on light volume. If prices are not moving or if heavy volume is required to move prices then the indicator will read near zero.
A buy signal is produced when it crosses above zero (an indication that prices are more easily moving upward ). A sell signal is produced when the indicator crosses below zero (prices are moving downward more easily)...
Daily Market Commentary
Updated Friday, 7/21 for Monday's market
Consolidating..
Read More...
Updated Friday, 7/21 for Monday's market
| Key DOW Levels for 7/24 | |
| UP | Above 10,925 |
| DN | Below 10,825 |
Consolidating..
- Dow extends decline, forms continuation pattern at lows. The index closed the day at the lows of the session with a 60 point loss and is now winding up for the next move.
- The NASDAQ and S&P each traded mostly sideways today after selling off in the opening minutes. Look for continued range movement until a clear and solid breakout occurs.
Summary
The Dow closed the near the lows of the session within the boundaries of a tight consolidation. This consolidation could lead to the next big test of critical support or it will make for another run at highs. Either way, this is the range to watch.
Read More...
Daily Market Commentary
Updated Friday, 7/21 for Monday's market
Consolidating..
Read More...
Updated Friday, 7/21 for Monday's market
| Key DOW Levels for 7/24 | |
| UP | Above 10,925 |
| DN | Below 10,825 |
Consolidating..
- Dow extends decline, forms continuation pattern at lows. The index closed the day at the lows of the session with a 60 point loss and is now winding up for the next move.
- The NASDAQ and S&P each traded mostly sideways today after selling off in the opening minutes. Look for continued range movement until a clear and solid breakout occurs.
Summary
The Dow closed the near the lows of the session within the boundaries of a tight consolidation. This consolidation could lead to the next big test of critical support or it will make for another run at highs. Either way, this is the range to watch.
- The NASDAQ and S&P each traded mostly sideways today after selling off in the opening minutes. Look for continued range movement until a clear and solid breakout occurs.
Summary
The Dow closed the near the lows of the session within the boundaries of a tight consolidation. This consolidation could lead to the next big test of critical support or it will make for another run at highs. Either way, this is the range to watch.
NYSE Chart of the Day

Daily Trading Signals
HOT is getting a solid downside break through clear support at 55.00, with assitance from a breakaway gap. This is very bearish and could send the stock into a steady decline. Watch for weakness beneath 56.00.
Daily Trading Signals
Trading Education Tutorial
Trendline Breaks
When is a Trend Truly Broken?
Read More...
Trendline Breaks
When is a Trend Truly Broken?
The importance of trendlines cannot be overstated when it comes to technical analysis. We are told to trade with the primary trend, exit when the trend reverses, enter on trend reversals, and so on. Trends are easy enough to identify, but when is a trend actually broken?
Read More...
![]()