Friday, May 19, 2006
Stock Scans
Worst Stocks Scan
Worst Stocks Scan
A couple times a year, it is a good idea to scan the universe of stocks and investigate those stocks that performed worst over the last 52 weeks; you often find some very interesting stories, occasionally get some good ideas...
Trading Stocks Picks - Read More
Swing Trade of the Week
NUE: Stock surged through a support area with a bearish colored candle, traded at the lower end of the bearish colored candle, representing a consolidation and possible setup for further downside...
Swing Trade Idea - Read More
Trading Ideas & Picks
STX completed a double top formation Tuesday, but then rose above the pivot line Wednesday. We believe that a secondary decline through the pivot line would result in a sharp drop...
Trading Picks - Read More
NASDAQ Chart of the Day

Daily Trading Signals
KOSP continues to wind up within the large triangle range. A breakout from this pattern at 46.00 or 50.00 could spark big movement.
Daily Trading Signals
Daily Market Commentary
Updated Thursday, 5/18 for Friday's market
Late-Day Decline
Read More...
Updated Thursday, 5/18 for Friday's market
| Key DOW Levels for 5/19 | |
| UP | Above 11,300 |
| DN | Below 11,100 |
Late-Day Decline
- Dow breaks intraday consolidation to downside, sells off to the Close.
- NASDAQ and S&P each traded sideways throughout the session today, but ended on very bearish notes. Look for another continuation pattern to form ahead of the next key move.
Summary
The Dow broke a very tight triangle consolidation to the downside late in the day, which continues to push the index lower. If the index breaks through 11,100, much more weakness could be seen. However, watch for a possible bounce, as the index gathers its composure.
Thursday, May 18, 2006
Technical Indicators
Commodity Selection Index (CSI)
Read More...As an indicator of momentum, the Commodity Selection Index, or CSI is designed to help select commodities suitable for short-term trading. Designed for short-term traders who can handle the risks associated with highly volatile markets, a high CSI rating indicates that the commodity has strong trending and volatility characteristics. These characteristics are brought out by the Directional Movement factor in the calculation - the volatility characteristic by the Average True Range factor.
CSI creator Welles Wilder describes his focus to trading commodities with high CSI values. As these commodities are highly volatile, they have the potential to make the quickest return in the shortest time.
CSI creator Welles Wilder describes his focus to trading commodities with high CSI values. As these commodities are highly volatile, they have the potential to make the quickest return in the shortest time.
Trading Signals of the Day
Bullish Reversal Triggers
 Reversal bars are an objective technique used to time the entry of a trade. Read More... http://daily-stocks.netfirms.com/daily-trading-triggers.htm
NASDAQ Chart of the Day

Daily Trading Signals
CENX is holding at key support at 44.00, which has held for two months. Watch this zone closely for a break or bounce.
Daily Trading Signals
Daily Market Commentary
Updated Wednesday, 5/17 for Thursday's market
Huge Sell-Off
Read More...
Updated Wednesday, 5/17 for Thursday's market
| Key DOW Levels for 5/18 | |
| UP | Above 11,500 |
| DN | Below 11,150 |
Huge Sell-Off
- Dow breaks triangle to downside, drops steadily to the Close.
- NASDAQ and S&P each broke their respective ranges to the downside today, but the tech-heavy index lagged the market in terms of the sell-off. Each index continues to push to new lows, but we may see another consolidation form ahead of the next move.
Summary
The Dow got a massive downside break from the large triangle consolidation at 11,400 today, which sent the index tumbling. After today's huge decline, we can expect the index to either hold at the lows or reverse in a reaction rally. Look for this tomorrow, as the index builds out for the next key move.
Wednesday, May 17, 2006
Trading Education Tutorial
Support and Resistance in an Uptrend
Read More...
Support and Resistance in an Uptrend
Although the motivation is not the same, many of the same forces that lead to technical downtrends are also at work in the creation of the technical uptrend. These patterns occur because investors chasing a strong stock rationalize that paying a higher than their intended purchase price is warranted given the strength of the issue. The higher the stock price moves, the more likely it is that investors will rationalize why paying a higher price makes sense -- to a point. Some will argue this rationalization process is directly related to a perceived change in fundamental factors and very often this is true. Understanding technical analysis does not mean that fundamental factors should be dismissed...
Read More...
Technical Indicators
Vertical Horizontal Filter
Created by Adam White, the Vertical Horizon Filter illustrates the trendiness of a particular equity. It helps display whether the stock is following a trend or a trading range.
If the Vertical Horizon Filter is rising, this may indicate a trend is forming. The higher the indicator, the better other trend-following indicators will work. Falling values may indicate that prices may be falling out of the trend and entering a congestion phase (the stock trades within a certain price range without much net up or down movement).
If the Vertical Horizon Filter is rising, this may indicate a trend is forming. The higher the indicator, the better other trend-following indicators will work. Falling values may indicate that prices may be falling out of the trend and entering a congestion phase (the stock trades within a certain price range without much net up or down movement).
Daily Market Commentary
Updated Monday, 5/15 for Tuesday's market
Large Consolidation
Read More...
Updated Monday, 5/15 for Tuesday's market
| Key DOW Levels for 5/17 | |
| UP | Above 11,500 |
| DN | Below 11,325 |
Large Consolidation
- Dow trades back and forth throughout session, holds within large sloping consolidation.
- NASDAQ and S&P each rallied late in the day to close the session with strength. Look for continued development of a potential continuation pattern tomorrow.
Summary
Today's late-day reaction rally pushed the index to the highs of the session. Look for the index to continue to build out at the lows of the overall decline as the next key move develops. A breakout from 11,330 and 11,460 should make for nice movement.each traded sideways-to-down today within the boundaries of their respective ranges. Look for continued range movement ahead of the next key move.
Summary
The Dow has begun to form the framework for a large continuation pattern after dropping steadily from last week's highs. The large consolidation is forming in the sharp of an upward-sloping triangle, which can be a very bearish pattern. Look for continued range development of this pattern before the next big breakout is seen.
NASDAQ Chart of the Day

Daily Trading Signals

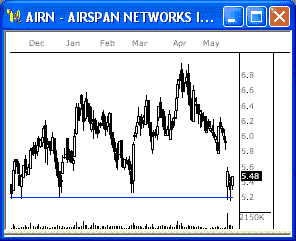
AIRN is holding at a key support level at 5.20, which has held for six months. A downside break of this level could be big for the bears, but an upside reversal through 5.65 could spark big strength.
Daily Trading Signals
Tuesday, May 16, 2006
Trading Ideas & Picks
SGP broke out on high volume Monday, after several months of consolidation. From early September of 2005 until early March of 2006, SGP declined from a high of 22.53 to a low of 17.88. After reaching these lows, the stock moved into a period of consolidation until Monday, when it broke out on high volume. We view the breakout as a very bullish sign...
Trading Picks - Read More
Technical Indicators
Force Index
Force Index
Developed by Dr. Alexander Elder, the Force Index combines price movements and volume to measure the market. Unmodified Force Index results can be rather erratic, better results are achieved by smoothing with an moving average. A 2-day exponential moving average of the Force Index may be used to track the strength of buyers and sellers in the short term while a 13-day exponential moving average better measures the strength of intermediate cycles.
If the Force Index is above zero Elder would say, "the bulls are in control." A negative Force Index would then signal that "the bears are in control." If the Index remains close to zero neither side has control and no strong trends exist.
Read More...If the Force Index is above zero Elder would say, "the bulls are in control." A negative Force Index would then signal that "the bears are in control." If the Index remains close to zero neither side has control and no strong trends exist.
NASDAQ Chart of the Day

Daily Trading Signals
PENN is breaking the neck line of a large head-and-shoulders pattern at 39.65, which is highly bearish. Watch for a steady decline to arise from this break.
Daily Trading Signals
Daily Market Commentary
Updated Monday, 5/15 for Tuesday's market
Late-Day Strength
Read More...
Updated Monday, 5/15 for Tuesday's market
| Key DOW Levels for 5/16 | |
| UP | Current Trend |
| DN | Below 11,325 |
Late-Day Strength
- Dow holds above 11,300, gets sharp upside reversal to the Close.
- NASDAQ and S&P each rallied late in the day to close the session with strength. Look for continued development of a potential continuation pattern tomorrow.
Summary
Today's late-day reaction rally pushed the index to the highs of the session. Look for the index to continue to build out at the lows of the overall decline as the next key move develops. A breakout from 11,330 and 11,460 should make for nice movement.
Monday, May 15, 2006
Trading Ideas & Picks
Notice that we did NOT break the 1635 support level though, it is the support level of our six months channel. This means, basically, that we are not yet in a long term down trend, the market is not out of the woods yet. We do expect some profit taking in the first part of the week, followed by further weakness and possible break of the 1635. We will believe it when we see it...
Trading Ideas & Picks
After declining fairly steadily for a month, ADI gapped up, and rose strongly on Friday; the rise was accompanied by very heavy volume and a bullish stochastic crossover in oversold territory...
Trading Picks - Read More
After declining fairly steadily for a month, ADI gapped up, and rose strongly on Friday; the rise was accompanied by very heavy volume and a bullish stochastic crossover in oversold territory...
Trading Picks - Read More
Daily Stock Picks
Bottoming - ADSX CBHI CHFC COHU CVTX DOVP DUSA ENCY ERES ESCL GENR GNSS INTV KSWS MOBE MSFT RAME THLD WFII
(Stocks making a 52 WK low but closing higher than they opened)
Hard Slams - EXPE EXPEZ INTZ THLD
(Price is more than 20% down; Volume is greater than Average for 6 Months)
Overreaction - CHTP EXPE EXPEZ HNAB INTZ THLD WSTL
(Potential Bullish Bounce: Stocks making a 52 WK low and moving down 10% or more in one day)
More... Stock Picks Page #1
NASDAQ Chart of the Day
Daily Trading Signals
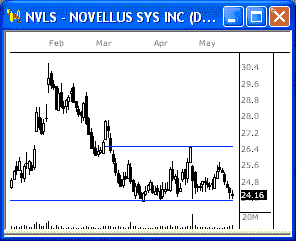
NLVS is trading in close proximity to a potential support level near 23.8. Look for a break below 23.6 to establish a short position. However, should NVLS continue to hold above 23.8, we could a sharp rally back toward recent highs near 26.6
Daily Trading Signals
Daily Market Commentary
Updated Friday, 5/12 for Monday's market
Support Break
Read More...
Updated Friday, 5/12 for Monday's market
| Key DOW Levels for 5/15 | |
| UP | Above 11,550 |
| DN | Below 11,350 |
Support Break
- Dow violates key support at 11,425.
- NASDAQ and S&P continue to capitulate in the face of recent weakness. Both indexes closed near session lows and in close proximity to potential support levels. Considering the severity of this week's losses, we are likely to witness a period of retracement and/or consolidation.
Summary
Today's definitive break below 11,425 provided a clear indication of weakness and may foreshadow a test of the upward sloping trend line near 11,200. However, in the near term, we are likely to endure a brief period of consolidation and/or retracement as the index digests the recent decline.
![]()