Friday, August 11, 2006
NASDAQ Chart of the Day

Daily Trading Signals
NOVL is winding up within a very tightly-wound triangle consolidation. A breakout from this pattern could yield nice movement. Watch 6.50 up, and 6.10 down.
Daily Trading Signals
NYSE Chart of the Day

Daily Trading Signals
URS has formed a tightly-wound triangle that we will watch closely for a big breakout. Watch 42.00 up, and 39.50 down.
Daily Trading Signals
Trading Education Tutorial
Double Tops and Bottoms

Waiting for the Setup to Complete Results in Profits
Read More...
Double Tops and Bottoms
Waiting for the Setup to Complete Results in Profits
There are various chart patterns that help us find good reversal candidates. Of the major reversal patterns, the double top or bottom is not only one of the most recognizable, but also one of the most predictive.
Read More...
Daily Market Commentary
Updated Thursday, 8/10 for Friday's market
Slow Uptrend
Read More...
Updated Thursday, 8/10 for Friday's market
| Key DOW Levels for 8/11 | |
| UP | Above 11,250 |
| DN | Below 11,040 |
Slow Uptrend
- Dow slowly higher from early lows, but remains beneath 11,150 level. The index pushed slowly higher throughout the day, but never really threatened highs or even resistance at 11,150. The index closed the day with a 48 point gain, but continues to look fairly week within the week's overall downtrend.
- The NASDAQ and S&P each pushed higher from early lows today, but continue to linger just above key support. Watch support closely for signs of key medium term direction.
Summary
The Dow ended the day with a gain after trending slowly higher throughout the session. Despite today's gains, we could see another downside assault. Watch 11,050 for early signs of weakness tomorrow. Otherwise, an upside push through 11,150 will indicate continued slow and steady strength.
Read More...
Trading Ideas & Picks
Trading Picks - Read More
CIEN: SDespite a falling stock price, money flow for CIEN has recently been very positive. With the stock now showing additional technical signs that an advance is likely to be imminent, we are bullish on the stock...
Trading Ideas & Picks
Trading Picks - Read More
EXBD: Stock surged below a support area with a bearish colored candle, then traded at the lower end of the bearish colored candle, representing a consolidation and possible setup for further downside. Look to go short at...
Trading Ideas & Picks
Trading Ideas - Read More
LEND: This stock is just now breaking down and is in a weak home lending group. I would consider a few shorts on this one here...
Trading Ideas - Read More
Trading Ideas & Picks
Trading Ideas - Read More
DRQ: If the oil stocks get going then this stock could make a nice move as earnings on this one are super. Buy point is when the stock moves above the upper trendline on good volume at $88.50...
Trading Ideas - Read More
Thursday, August 10, 2006
NASDAQ Chart of the Day

Daily Trading Signals
BOBE has gotten a big downside break through the bottom of a large saucer-top range via a breakaway gap and high volume, which is bearish. Watch for continued weakness out of this large pattern.
Daily Trading Signals
NYSE Chart of the Day

DIS is winding up beautifully within the boundaries of a large triangle range. A breakout from this range will likely spark a new trend in the direction of the break. Watch 30.15 up, and 28.50 down.
Daily Trading Signals
DIS is winding up beautifully within the boundaries of a large triangle range. A breakout from this range will likely spark a new trend in the direction of the break. Watch 30.15 up, and 28.50 down.
Daily Trading Signals
Daily Market Commentary
Updated Wednesday, 8/9 for Thursday's market
Reversal & Drop
Read More...
Updated Wednesday, 8/9 for Thursday's market
| Key DOW Levels for 8/10 | |
| UP | Above 11,250 |
| DN | Below 11,050 |
Reversal & Drop
- Dow reverses from early highs, drops hard to the Close. The index formed yet another lower high beneath the key 11,300 level, which added to the bearishness this afternoon and the ultimate 97 point drop in the index..
- The NASDAQ and S&P each sold off steadily this afternoon and are headed to support. Watch support for additional selling pressure.
Summary
The Dow closed the day at the lows of the session and is now breaking through key support at 11,085, which is highly bearish. Look for a continuation pattern to form that will push the index even lower. Continued overall weakness should be seen beneath 11,150.
Read More...
Trading Education Tutorial
Volume Climax

Volume Helps Identify Reversals
Read More...
Volume Climax
Volume Helps Identify Reversals
Various price patterns can alert us to potential reversal candidates. Trendline Breaks, Support and Resistance Levels, Fibonacci Retracement Levels and other price information are valuable in determining a change in direction for a security. However, one of the most overlooked chart patterns that help us determine reversals is not reflected in the price itself. Volume climaxes are easily identifiable and valuable in assessing a change in market sentiment.
Read More...
Wednesday, August 09, 2006
NASDAQ Chart of the Day

Daily Trading Signals
EQIX is coiling up within the boundaries of a clear triangle, which we will watch for a solid breakout move. Watch 52.00 up, and 47.00 down.
Daily Trading Signals
NYSE Chart of the Day

Daily Trading Signals
NDE has gotten a clear downside reversal from the top of a downtrending channel and is now filling a bearish exhaustion gap. Look for continued weakness beneath 45.00.
Daily Trading Signals
Daily Market Commentary
Updated Tuesday, 8/8 for Wednesday's market
Late-Day Decline
Read More...
Updated Tuesday, 8/8 for Wednesday's market
| Key DOW Levels for 8/9 | |
| UP | Above 11,300 |
| DN | Below 11,125 |
Late-Day Decline
- Dow trades quietly throughout session, but gets late-day sell-off to the Close. The index broke through 11,200 and eventually pushed down to the Close for a 46 point loss.
- The NASDAQ and S&P each reversed from late-day highs en route to steady weakness to the Close. Each index continues to hold above clear support, which will be our focus tomorrow.
Summary
The Dow closed the day sharply lower from the highs of the day after another failed attempt at 11,300 sent the index tumbling. The index is now holding above key support at 11,085, which we will watch for the next big medium term move.
Read More...
Trading Education Tutorial
Trading Ranges

Big Moves Occur Outside of the Range
Read More...
Trading Ranges
Big Moves Occur Outside of the Range
A trading range is basically a horizontal channel in which a security moves from the high and low of the channel for an extended amount of time. Obviously, the upper level of the range can be considered resistance and the lower level represents support. Trading within a range is possible, but it's the breakout from the range that provides the best opportunities.
Read More...
Tuesday, August 08, 2006
Trading Ideas & Picks
Trading Picks - Read More
LBIX has broken down from a double top formation on high volume; the rise that preceded the double top formation was associated with negative money flow, suggesting institutional sales. The confluence of the two bearish signals leads us to have a negative outlook...
Trading Ideas & Picks
Trading Ideas - Read More
BRCM showed major support at 24 in yesterday's trading session. The 1 day, 1 minute bars chart below give you a visual perspective as to just how significant this support level was. A break of 24 support on heavy volume will likely lead to continued downside action. A move to the downside on light volume will likely result in continued support at 24, followed by upside price action...
Trading Ideas - Read More
NASDAQ Chart of the Day

Daily Trading Signals
CLDN is forming a large head-and-shoulders pattern at the highs of a big uptrend, which is very bearish. A downside break through the neck line in this pattern at 16.00 could spark big weakness ahead.
Daily Trading Signals
NYSE Chart of the Day
Daily Trading Signals
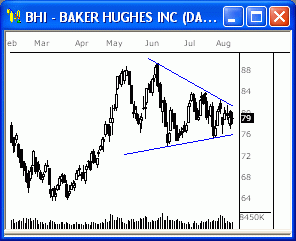
BHI is winding up within a very large triangle range, which has formed at the highs of the Spring rally. Watch for a breakout from this range for big movement: 81.50 up, and 76.00 down.
Daily Trading Signals
Trading Education Tutorial
Support and Resistance Levels

History Tells Us When Securites are Overbought or Oversold
Read More...
Support and Resistance Levels
History Tells Us When Securites are Overbought or Oversold
Support indicates a level on the chart where we can expect an increase in the demand for a security (buyers take over). How do we know this? By identifying this reaction to this price level in the chart's history.
Read More...
Daily Market Commentary
Updated Monday, 8/7 for Tuesday's market
Holding...
Read More...
Updated Monday, 8/7 for Tuesday's market
| Key DOW Levels for 8/8 | |
| UP | Above 11,375 |
| DN | Below 11,175 |
Holding...
- Dow trades quietly throughout session, holds above 11,200 level. The index closed the day with a relatively mild 21 point decline, but could be gearing up for a much steeper sell-off ahead.
- The NASDAQ and S&P each traded quietly sideways today, forming small consolidations at the lows. A breakout from these ranges could spark nice movement tomorrow.
Summary
The Dow closed the day with a mild loss today, but continues to hold within the boundaries of a tight consolidation above key near-term support at 11,200. A big downside break through 11,200 could spark big selling pressure. Otherwise, look for continued sideways-to-up movement in the near-term ahead of a decisive breakout.
Read More...
Monday, August 07, 2006
Daily Stock Picks
Bottoming -
Aug 4 for Aug 7:
CVTX DDDC GGBM
(Stocks making a 52 WK low but closing higher than they opened)
Oversold Stocks -
Aug 4 for Aug 7:
BIOS CCRT PDLI SFCC
(Stocks closing higher than they opened, crossing up through their 25 Stochastic level, and on 150% + greater than average 6 month volume)
Overreaction -
Aug 4 for Aug 7:
CECO CRMH CVTX DOVP GGBM ICGN LQDT MVIS TRMM
(Potential Bullish Bounce: Stocks making a 52 WK low and moving down 10% or more in one day)
More... Stock Picks Page #1
Technical Indicators
Volume Accumulation
Read More...Created by Mark Chaikin, the Volume Accumulation Oscillator shows the cumulative volume adjusted by the difference between the close and the midpoint of the day's range.
Compared to the On Balance Volume (OBV) indicator which assigns all the day's volume to the buyers if a security closes up or to the sellers if it closes down, Volume Accumulation uses the relationship of the closing price to the mean price to assign a proportion to the volume.
Use the Volume Accumulation Oscillator as you would the OBV and let volume confirm a trend. A rising price trend will be confirmed by a rising VA line. An uptrend paired with a rising Volume Accumulation line is considered bullish while a Volume Accumulation line that diverges from the price direction of movement should warn of a near-term price correction...
NASDAQ Chart of the Day
Daily Trading Signals
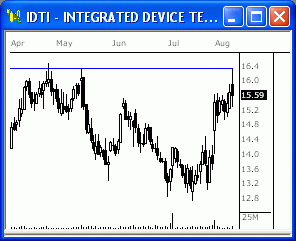
IDTI reached resistance at 16.40, but got a solid downside reversal today. If the stock continues to hold beneath this resistance level, we could see big weakness ahead.
Daily Trading Signals
NYSE Chart of the Day
Daily Trading Signals
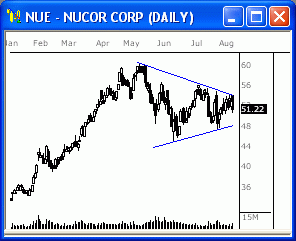
NUE has formed a large triangle range at the highs of a huge advance. Watch for a breakout from this range for the next big trending move. Watch 54.00 up and 48.00 down.
Daily Trading Signals
Daily Market Commentary
Updated Friday, 8/4 for Monday's market
Massive Reversal
Read More...
Updated Friday, 8/4 for Monday's market
| Key DOW Levels for 8/7 | |
| UP | Above 11,350 |
| DN | Below 11,175 |
Massive Reversal
- Dow rallies at Open, but gets huge sell-off from early highs. The index got a sharp v-top reversal from the day's highs and proceeded to sell off 160 points in steep and steady fashion. The index bounced late in the day and eventually closed the session with just a 2 point loss, but we could see much more selling ahead.
- The NASDAQ and S&P each reversed sharply from opening highs and could be headed much lower if key lower trend lines are violated. Watch these lines early next week.
Summary
The Dow got a massive downside reversal after racing to new highs right at the beginning of the session. This does not bode well for the bulls and could become the top of another bearish decline back to 10,700. Watch the key lower trend line at 11,175 for early weakness Monday.
Read More...
Trading Education Tutorial
Fibonacci Retracement Levels

Using Retracement Levels in Your Trading
Read More...
Fibonacci Retracement Levels
Using Retracement Levels in Your Trading
Leonardo Fibonacci da Pisa was a thirteenth century mathematician who (re) discovered what is today known as the Fibonacci sequence. Adding 1+1 and then continuing to add the sum to the previous number will arrive at this numerical sequence. The sequence gives rise to the following numbers: 1, 1, 2, 3, 5, 8, 13, 21, 34, 55 and so on.
Read More...
![]()