Friday, September 15, 2006
NASDAQ Chart of the Day

Daily Trading Signals

KNDL has gotten a big breakout move out of a clear triangle via a breakaway gap on increased volume, which is highly bullish. Watch for continued strength from this pattern.
Daily Trading Signals
NYSE Chart of the Day
Daily Trading Signals

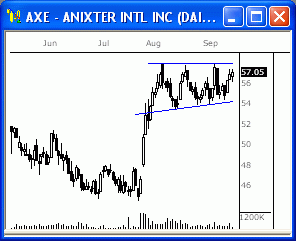
AXE is holding within the boundaries of a clear consolidation that has formed at the highs from 54.00 to 58.00. Watch for a breakout from this range for the next key move.
Daily Trading Signals
Technical Indicators
Zig Zag
Read More...The Zig Zag indicator shows past performance trends and only the most significant changes. It does this by filtering out any changes less than a specified amount.
The Zig Zag indicator is used primarily to help you see changes by highlighting the most significant reversals. Understand that the last segment in a Zig Zag chart can change based on changes in the underlying plot, price being only one example. That is, a change in a security's price can change a previous value of the indicator. Since the Zig Zag indicator adjusts its values based on subsequent changes, it has perfect hindsight into what prices have done. Do not try to create a trading system based on the Zig Zag indicator, as it to be used to illustrate historical patterns.
The Zig Zag indicator is calculated by placing imaginary points on a chart when prices reverse by at least the specified amount. Straight lines are then drawn to connect these imaginary points. Any changes in prices that are less than the specified amount are ignored.
Trading Education Tutorial
Saucer Patterns

Rare Pattern Is One of the Most Predictive
Read More...
Saucer Patterns

Rare Pattern Is One of the Most Predictive
One of the most predicitive chart patterns you will come across is the saucer pattern. Saucers are also referred to as "bowls" or even "rounded tops or bottoms", and one look at this pattern tells where these names are derived from. However, there is a problem with saucer patterns - they're hard to find.
Read More...
Daily Market Commentary
Updated Thursday, 9/14 for Friday's market
Winding Up...
Read More...
Updated Thursday, 9/14 for Friday's market
| Key DOW Levels for 9/15 | |
| UP | Above 11,550 |
| DN | Below 11,500 |
Winding Up...
- Dow trades quietly sideways, forms clear triangle consolidation at highs. The Dow is winding up within the boundaries of a clear triangle consolidation that we will want to watch for the next big breakout move.
- The NASDAQ and S&P each traded basically flat today, as each is consolidating at the current highs. Look for continued range development, but for a breakout to be near.
Summary
The Dow traded sideways throughout the day and is now winding up within a tight triangle pattern, which could pack some punch tomorrow. A breakout from this consolidation could push the Dow to our 11,650 target, or it could lead to a steep sell-off back to the 11,400 zone. Watch it closel.
Read More...
Thursday, September 14, 2006
NASDAQ Chart of the Day
Daily Trading Signals

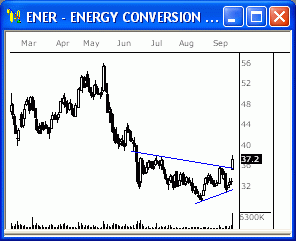
ENER has reversed from the bottom of a clear triangle consolidation and has gotten a big upside break through the top of the pattern at 36.00 via a breakaway gap, which is highly bullish. Look for continued strength out of this pattern.
Daily Trading Signals
NYSE Chart of the Day

Daily Trading Signals

PG has gotten a bearish reaction to key resistance at 62.40, which has held since March. Look for a sizeable retracement to occur from this level if 62.40 is not crossed to the upside.
Daily Trading Signals
Trading Signals of the Day
Bullish Reversal Triggers

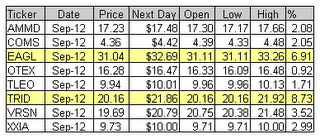
Reversal bars are an objective technique used to time the entry of a trade. Read More... http://daily-stocks.netfirms.com/daily-trading-triggers.htm
Trading Education Tutorial
Triangles

Tightening Price Action Leads to a Breakout
Read More...
Triangles

Tightening Price Action Leads to a Breakout
There are various forms of consolidation and they occur anytime there is an equilibrium of buyers and sellers. One of the most predictive consolidation formations is the triangle.
Read More...
Daily Market Commentary
Updated Wednesday, 9/13 for Thursday's market
Continued Strength
Read More...
Updated Wednesday, 9/13 for Thursday's market
| Key DOW Levels for 9/14 | |
| UP | Above 11,575 |
| DN | Current Trend |
Continued Strength
- Dow continues steady advance, closes near highs. The index has now run 147 points after breaking out of the triangle yesterday, but still needs to hit 11,650 before the target is reached.
- The NASDAQ and S&P each held gains today, but the tech-heavy index was much more reluctant to rally like the Dow and S&P. Look for a breakout from a continuation pattern to indicate that further strength is likely.
Summary
The Dow closed the day with another solid gain and continues to extend gains out of the triangle. Look for a continuation pattern to form en route to the potential target of 11,650. The index should continue to be highly bullish above 11,500.
Read More...
Wednesday, September 13, 2006
Technical Indicators
Moving Average, Displaced
Read More...PThe Displaced Moving Average takes the current moving average and shifts it forward (or backward) in time. Use to de-trend the data, for cycle estimation, for phasing or as a simple moving average trading system.
While the first number in the study specifies the period of a simple moving average (e.g., 28 days), the second parameter specifies the shift period (e.g., 5 days); enter a negative number to shift the moving average back (e.g., -14 days). When the moving average is shifted back, the remaining portion of the study is computed with the moving average based on the available data for each day (e.g., 13 days, 12 days, etc.)
The mathematics of a moving average will always force it to follow or lag the actual price data. By centering the moving average, you will have a more accurate picture of the moving average relative to the current price on the chart. A Displaced Moving Average study could be quite useful in locating and estimating cycles...
NASDAQ Chart of the Day

Daily Trading Signals

ZBRA is getting an upside break from a highly bullish inverted head-and-shoulders pattern at 34.50. This break could lead to much more strength ahead.
Daily Trading Signals
NYSE Chart of the Day
Daily Trading Signals

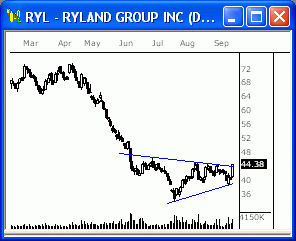
RYL is winding up with a beautiful triangle pattern and is currently testing the upper boundary of this pattern at 44.50. An upside break through the top of this pattern could spark a huge advance from this stock. Also watch 39.00 for a possible downside break.
Daily Trading Signals
Daily Market Commentary
Updated Tuesday, 9/12 for Wednesday's market
Huge Breakout & Rally
Read More...
Updated Tuesday, 9/12 for Wednesday's market
| Key DOW Levels for 9/13 | |
| UP | Above 11,525 |
| DN | Current Trend |
Huge Breakout & Rally
- Dow breaks triangle to upside, rallies for triple-digit gain. Continued overall strength out of this pattern is likely, but we could see an interim continuation pattern form beforehand.
- The NASDAQ and S&Peach got huge breakouts from their respective ranges, which led to big strength to the Close. Look for signs of a continuation tomorrow.
Summary
The Dow ended the day sharply higher after breaking through the top of a key triangle range today. The index rallied for a triple-digit gain and is now at four month highs. Look for a continuation pattern to form to indicate that continued overall strength is likely.
Read More...
Trading Education Tutorial
Measured and Exhaustion Gaps

Identifiable Patterns After Confirmation Move
Read More...
Measured and Exhaustion Gaps

Identifiable Patterns After Confirmation Move
We have previously mentioned the three types of gaps that are of relevance to investors - the breakaway gap, the measured (or continuation) gap, and the exhaustion gap. We previously discussed the breakaway gap, but it is important to discuss the measured gap and exhaustion gap at the same time. Why? Because it is difficult to tell one from the other until after the fact.
Read More...
Trading Signals of the Day
Bullish Reversal Triggers

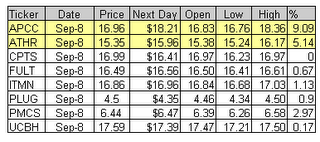
Reversal bars are an objective technique used to time the entry of a trade. Read More... http://daily-stocks.netfirms.com/daily-trading-triggers.htm
Tuesday, September 12, 2006
NASDAQ Chart of the Day

Daily Trading Signals

ADSK is winding up within the boundaries of a large triangle range, which we will watch closely for a huge breakout opportunity. Watch 31.50 down, and 35.00 up for the breakout.
Daily Trading Signals
NYSE Chart of the Day

Daily Trading Signals

A has formed a tight consolidation beneath key resistance from 30.30 to 32.35, which we will watch for a solid breakout. An upside break through the top of the consolidation and through resistance could spark a solid advance, but also watch 30.30 for signs of another test at recent lows.
Daily Trading Signals
Trading Education Tutorial
Support and Resistance Levels

History Tells Us When Securites are Overbought or Oversold
Read More...
Support and Resistance Levels

History Tells Us When Securites are Overbought or Oversold
Support indicates a level on the chart where we can expect an increase in the demand for a security (buyers take over). How do we know this? By identifying this reaction to this price level in the chart's history.
Read More...
Daily Market Commentary
Updated Monday, 9/11 for Tuesday's market
Winding Up
Read More...
Updated Monday, 9/11 for Tuesday's market
| Key DOW Levels for 9/12 | |
| UP | Above 11,425 |
| DN | Below 11,340 |
Winding Up
- Dow reverses from early lows to develop large triangle range. The index came close to getting a solid breakout at 11,425, but reversed from the day's highs to complete a large triangle range that we will watch for key medium term direction.
- The NASDAQ and S&P each reversed from early lows today to recover gains for the session. Each index continues to wind up within a highly explosive pattern, which we will continue to watch for a big breakout.
Summary
The Dow closed the day winding up within the boundaries of a large triangle range, which we will watch to watch closely for the next big breakout move. Watch 11,425 and 11,340 for a solid breakout.
Read More...
NASDAQ Chart of the Day
Daily Trading Signals

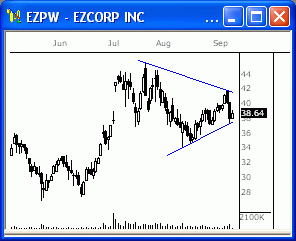
EZPW is winding up within the boundaries of a large triangle consolidation. A breakout from this range could be huge. Watch 42.00 up, and 37.00 down.
Daily Trading Signals
NYSE Chart of the Day
Daily Trading Signals

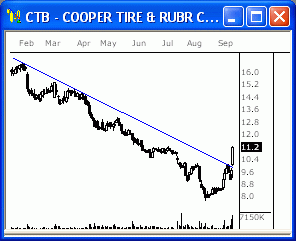
CTB has broken a major upper trend line at 10.00 on high volume, which is quite bullish. This upper line had been in tact since last January, which makes this break a big deal. Watch for continued strength from this stock.
Daily Trading Signals
Trading Education Tutorial
Island Reversals

Stand Alone Formation Speaks Volumes
Read More...
Island Reversals

Stand Alone Formation Speaks Volumes
Reversals tend to occur slowly, with securities forming double bottoms, higher lows, head and shoulders patterns, etc. before starting a new trend. However, sometimes we see a dramatic reversal immediately, and one of the best indications of these types of reversals is Island Tops and Bottoms.
Read More...
Daily Market Commentary
Updated Friday, 9/8 for Monday's market
Back at 11,400
Read More...
Updated Friday, 9/8 for Monday's market
| Key DOW Levels for 9/11 | |
| UP | Above 11,450 |
| DN | Below 11,325 |
Back at 11,400
- Dow trends slowly higher throughout session, halts advance at 11,400. The index closed the day just beneath this key level and ended the day with a 61 point gain.
- The NASDAQ and S&P each pushed slowly higher throughout the session, but continue to look bearish in the medium term. Watch the consolidation ranges for a breakout Monday.
Summary
The Dow ended the day with a nice gain after pushing higher throughout the day. The index is now holding just beneath the key 11,400 fulcrum, which we will continue to watch. Keep an eye on the large head-and-shoulders pattern that could be forming the Daily and 60 Minute Charts.
Read More...