Friday, October 13, 2006
Trading Tools
Shogun Swing Trading - Best Swing Trading:Shogun Trading's approach can benefit all stock traders, from day traders to long term swing traders. We are proud to show some of the best Performance in
Day Trading,
Longer Term Swing Trading Strategy,
Systemized Swing Trading and through our
Educational Courses and Videos...
» Get More Info Now!
NASDAQ Chart of the Day

COST has gotten a big breakout move through a clear upper trend line via a breakaway gap and increased volume at 51.00. Look for continued overall strength out of this pattern.
Daily Trading Signals
NYSE Chart of the Day FRK
FRK is getting a solid breakout from a clear consolidation at 40.00, which is quite bullish. Look for continued strength out of this pattern.
Daily Trading Signals
Technical IndicatorsDemarker Indicator
Developed by Tom Demarker, the Demarker Indicator is an oscillator which identifies risk areas for buying and selling. It is an attempt to overcome the shortcomings of classical overbought / oversold indicators, making price comparisons from one bar to the next and measuring the level of price demand.
It is similar to the Demarker Range Expansion Index in that it identifies price exhaustion that normally correspond with tops and bottoms. The x-axis ranges from -100 to 100. Look for rises above 60 to indicate low risk and look for areas below 40 to indicate high risk...
Read More...
Trading Education Tutorial
Fibonacci Retracement Levels Using Retracement Levels in Your Trading
Leonardo Fibonacci da Pisa was a thirteenth century mathematician who (re) discovered what is today known as the Fibonacci sequence. Adding 1+1 and then continuing to add the sum to the previous number will arrive at this numerical sequence. The sequence gives rise to the following numbers: 1, 1, 2, 3, 5, 8, 13, 21, 34, 55 and so on.
Read More...
Daily Market Commentary
Updated Thursday, 10/12 for Friday's market's market | Key DOW Levels for 10/13 |
| UP | Above 11,975 |
| DN | Below 11,900
|
Solid Breakout
- Dow gets big breakout from consolidation range, rallies to the Close. The index eventually closed the day with a solid 96 point gain, but could be headed higher still.
- The NASDAQ and S&P each got solid breakouts from their respective consolidations. Look for continued overall strength, especially should continuation patterns form in the process.
Summary
The Dow closed out the day with a solid move higher to the Close to cap a highly bullish breakout from the tightly-wound consolidation. Look for continued overall strength to 12,050 in the near-term, especially if the Dow continues to hold above 11,900.
Read More...
Thursday, October 12, 2006
Quantum Swing Trader - Discover Where Stock Market Potential Becomes RealityIf you had a stock trading method that let you discover when a stock was about to make a massive move UP or DOWN, and then showed you, step-by-step, how to take advantage of that move to potentially pull profits out of the markets... would you be interested?
The "sweet spot" of Quantum Swing Trader is that it shows you how to take just a few common indicators, but use them in an uncommon way to "pinpoint" the spot in any stock where it has a high probability of making a massive move UP or DOWN, but not stay the same.
* Quantum Swing Trader - Limited Edition*
Trading Education Tutorial
Trendline Breaks When is a Trend Truly Broken?
The importance of trendlines cannot be overstated when it comes to technical analysis. We are told to trade with the primary trend, exit when the trend reverses, enter on trend reversals, and so on. Trends are easy enough to identify, but when is a trend actually broken?
Read More...
Trading Ideas & PicksSHLD: This stock is back already after a minor breakout failure last week. I would consider a few more now when this stock hits $166 on heavy volume...
Trading Ideas & PicksTHC: The 50-day moving average has recently crossed above the 200-day moving average, which is generally used by technical traders as confirmation of the beginning of a new long-term uptrend...
Trading Ideas & PicksSYNA: Stock broke through a support area, then traded at the lower end of the bearish colored candle, representing a consolidation and possible setup for further downside. Look to go short at 21.21 as the stock continues with its breakdown out of the recent trading range...
Trading Ideas & PicksGENC: The ascending trendline has become an area of resistance since the price fell below it in mid April. Also notice how the price action has trended sideways since late July. Earnings may be the catalyst that is need to send the price of GENZ beyond the resistance of $70, or below the support near $64...
NYSE Chart of the Day
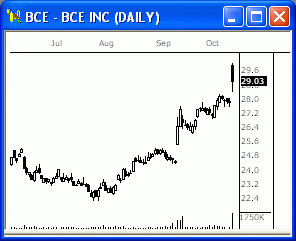
BCE took a large gap up today, but immediately began to fill the gap on high volume. This could be our first indication of a potentially bearish exhaustion gap or a potential volume climax, both of which indicate potential selling ahead. Watch 28.00 for signs of continued weakness.
Daily Trading Signals
NASDAQ Chart of the Day

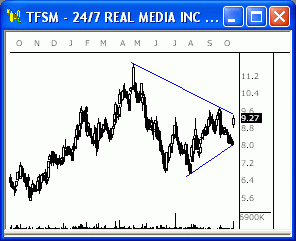
SGTL is challenging the upper trend line of a clear triangle consolidation that could send this index much higher. Watch for follow-through above 5.25 for signs that we could see movement back toward the 8.50 range.
Daily Trading Signals
Daily Market Commentary
Updated Wednesday, 10/11 for Thursday's market | Key DOW Levels for 10/11 |
| UP | Above 11,900 |
| DN | Below 11,790
|
Still in the Range...
- Dow remains within key consolidation range, continues to build toward breakout. The index closed the day with a very volatile sell-off and recovery, and eventually ended with a 15 point loss.
- The NASDAQ and S&P each pulled back from early highs to further define the large consolidation ranges. Look for further range movement until a solid breakout is seen.
Summary
The Dow continues to trade strictly within the boundaries of the clear consolidation, which we will continue to watch closely. A breakout from this range will finally spark key movement in the next day or two.
Read More...
Quantum Swing Trader
| "Profit Feeder" preview
A complimentary trading gift for you that you probably won't see anywhere else.
Access the QST's Profit Feeder Members Website Preview - FREE Tryout!
Take a preview of what is already being called one of the best and most complete stock trading courses ever released to the public. Everything about it is first class... and easy to understand.
Next week, on Tuesday, October 17, at 9am eastern time, 200 more copies of 30+ year veteran trader Bill Poulos' Quantum Swing Trader course will be released to the trading community.
This is the same course that's already sold out 3 times this year, and this fourth limited release is sure to follow this pattern.
Bill's website has received over 20,000 visits in the past few weeks since he first leaked word of this re-release. So to help traders make an informed decision on this groundbreaking course, Bill is tearing open the "digital doors" to his exclusive Members Website Preview for Quantum Swing Trader.
| |
You can access it here:
Profit Feeder Members Website FREE Preview
Here's what's waiting for you on the Preview site:
** QST Video Trading Vault: Get complete access to a library of recent trade videos including actual trades that Bill's students have placed using his course.
** CD-ROM Previews: Get an up-front and personal preview of each and every CD-ROM included in the Quantum Swing Trader course. You'll see exactly what appears on your screen as a student.
** Manual Preview: Get a taste of Bill's teaching style with a digital preview of the Quantum Swing Trader manual. This is the same manual that arrives in full color on your doorstep when you become a Quantum Swing Trader student.
There's a whole lot more, but don't take my word for it. Go ahead and check it out now while it's still available by visiting the web page here:
Profit Feeder Members Website FREE Preview
|
The Ultimate Trading Machine
| 17 Positive Days In A Row
Is this even possible?
That may be what you thought when you read the subject of this email. Well what if I can prove it to you.
This system isn't called the Pretty Good Trading Machine, or the Great Trading Machine, no. It's called the 'Ultimate Trading Machine' (UTM) and it earned that name for one reason, the precise trade setups it identifies day after day.
You can see those very trades right away at
Ultimate Trading Machine Preview
There are currently just two hundred and fifty owners of the system in the world. That's because in our only previous release (which was done exclusively to NetPicks subscribers) we limited the numbers to that amount.
We sold out in just a few days.
This is the first ever release of the system outside our private list, however it is still limited in scope. We have a few key partners working with us, and if you're not on their list, you won't ever hear about the UTM. It's not in Google, it's not in Yahoo, and you won't find any flashy banner ads all over the trading websites like so many 'other' systems. | |
And one more thing, it will only be available for very short time, and then it will be gone. We limit the numbers, to a select few, otherwise it could possibly affect the markets.
What if you knew exactly where to get into a trade, and exactly where to get out. No guessing, no wondering, and absolutely NO fear whatsoever. And, what if each night you could come into the Owners Club (our private community of UTM owners which we'll tell you more about soon) and see video produced for you, going over the exact same trades you took that day. The same trades we ALL took, including the developers of the system themselves.
I said at the top of the email I'd show you that we just came off a streak of 17 straight days in a row. Well, let me prove it.
To see how we did it, go to:
Ultimate Trading Machine Preview
Take a look and you will immediately stop doubting what is possible. You'll open your eyes and mind to a non-subjective, straight forward system you can learn in days instead of months. All built around one single indicator. A system called The Ultimate Trading Machine.
|
Wednesday, October 11, 2006
Technical IndicatorsFisher Transform
The Fisher Transform indicator attempts to be a major turning point indicator and is based on John Ehlers' November 2002 Stocks and Commodities Magazine article, "Using The Fisher Transform."
With distinct turning points and a rapid response time, the Fisher Transform uses the assumption that while prices do not have a normal or Gaussian probability density function (that familiar bell-shaped curve), you can create a nearly Gaussian probability density function by normalizing price (or an indicator such as RSI) and applying the Fisher Transform. Use the resulting peak swings to clearly identify price reversals...
Read More...
Trading Education Tutorial
Triangles Tightening Price Action Leads to a Breakout
There are various forms of consolidation and they occur anytime there is an equilibrium of buyers and sellers. One of the most predictive consolidation formations is the triangle.
Read More...
NASDAQ Chart of the Day

EEFT is winding up within the boundaries of a very tight triangle consolidation. A breakout from this pattern could spark big movement. Watch 25.50 up, and 24.00 down.
Daily Trading Signals
NYSE Chart of the Day
SM has formed an inverted head-and-shoulders pattern off key support at 34.00. An upside break through 37.00 could spark a solid upside move back toward recent highs at around 44.00.
Daily Trading Signals
Daily Market Commentary
Updated Tuesday, 10/10 for Wednesday's market | Key DOW Levels for 10/11 |
| UP | Above 11,900 |
| DN | Below 11,800
|
In the Range...
- Dow trades sideways throughout session, continues development of consolidation. The index closed another quiet session with a modest 9 point gain, but continues to gear up for a potentially huge breakout move.
- The NASDAQ and S&P each traded slowly sideways today, but look to be developing 'topping out' patterns. Look for a breakout from this range for the next big move.
Summary
The Dow ended the day slightly higher, but continues to hold within the boundaries of the current five-day consolidation. Look for an eventual breakout from this consolidation for the next key move.
Read More...
Tuesday, October 10, 2006
NYSE Chart of the Day
HOV has formed a large saucer pattern at the lows, which is shaping up to be bullish. An upside break through the lip of the saucer at 32.00 could spark big strength ahead.
Daily Trading Signals
NASDAQ Chart of the Day
AMKR has gotten a big upside break through a major upper trend line via a breakaway gap and high volume, which is quite bullish. Watch for a continuation higher through 7.25 for continued strength.
Daily Trading Signals
Trading Ideas & PicksACN: Stock is in a long term secular uptrend as seen in the above chart. The stock has recovered from the fall it witnessed in mid June. The stock made a good bottom at 26.10 levels and has been steadily moving up. The stock is trading above its 10-Day EMA of 30.52 and the 7-Day Average Directional Indicator has generated a strong buy signal. All the short term indicators are in the buy zone...
Trading Ideas & PicksHD: Stock is in a medium term uptrend as seen in the above chart. The stock has recovered from the fall it witnessed in July-August. The stock made a good bottom at 33.25 levels and has been steadily moving up. The stock is trading above its 10-Day EMA of 36.51. The 7-Day Average Directional Indicator and the 20-Day Moving Average are in the buy zone...
Trading Education Tutorial
Consolidations Sideways Movement Gives Indication of Future Price Direction
A consolidation is a place where buyers and sellers are very closely matched in numbers. As the battle ensues, others notice that the market is consolidating, and begin considering to get on board. As soon as a break from the consolidation occurs, the latent buyers or sellers usually begin taking positions.
Read More...
Daily Market Commentary
Updated Monday, 10/9 for Tuesday's market | Key DOW Levels for 10/10 |
| UP | Above 11,900 |
| DN | Below 11,800
|
Still Consolidating...
- Dow continues sideways within tight consolidation, builds toward potential breakout. The index gained just 8 points for the day, but is definitely gearing up for a big potential breakout move.
- The NASDAQ tried to rally the broader market today and has only half successful. The index broke out to new highs within the overall uptrend, but the S&P continues to hold within its consolidation range. Look to near-term support for the next key move.
Summary
The Dow closed the day within the boundaries of the very clear consolidation that has formed at the overall highs. Look for the index to build out this range a bit more before the next key breakout move is seen. Watch this range closely.
Read More...
Monday, October 09, 2006
Trading Ideas & Picks
Market is in the up trending channel, in which it has been for many weeks now. More than likely it will continue in this channel. 200MA is moving sideways, while shorter term MAs are trending up. Resistance level of NDX is at 1700, but some profit taking and consolidation may very well occur before resistance is taken out. If the up channel is broken to the downward, first line of support will be 1626 - 200MA...
Trading Ideas & PicksQQQQ: We've identified a new trendline that should become an area of support if the bears respond to the rally and push the index lower. Another point of interest is how the QQQQ is now substantially above the 200-day moving average, which could also suggest that the long-term trend of the QQQQ is shifting upward again...
Technical IndicatorsChaikin Money Flow
Developed by Marc Chaikin, the Chaikin Money Flow compares total volume to the closing price and the daily highs and lows to determine how many issues are bought and sold of a particular security. It is based upon the assumption that a bullish stock will have a relatively high close price within its daily range and have increasing volume. However, if a stock consistently closed with a relatively low close price within its daily range with high volume, this would be indicative of a weak security. There is pressure to buy when a stock closes in the upper half of a period's range and there is selling pressure when a stock closes in the lower half of the period's trading range. Of course, the exact number of periods for the indicator should be varied according to the sensitivity sought and the time horizon of individual investor.
An obvious bearish signal is when Chaikin Money Flow is less than zero. A reading of less than zero indicates that a security is under selling pressure or experiencing distribution.
A second potentially bearish signal is the length of time that Chaikin Money Flow has remained less than zero. The longer it remains negative, the greater the evidence of sustained selling pressure or distribution. Extended periods below zero can indicate bearish sentiment towards the underlying security and downward pressure on the price is likely...
Read More...
NASDAQ Chart of the Day
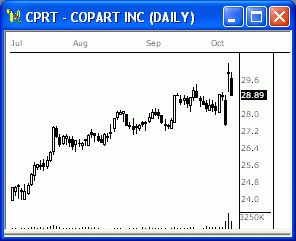
CPRT is beginning to fill a large gap to the downside on increased volume, which is quite bearish. Watch 28.75 for signs of a continuation.
Daily Trading Signals
NYSE Chart of the Day

AYI has filled a large gap to the downside on high volume, which could send this stock much lower. Watch 46.50 for signs of continued weakness from current highs.
Daily Trading Signals
Trading Education Tutorial
Support and Resistance Levels History Tells Us When Securites are Overbought or Oversold
GSupport indicates a level on the chart where we can expect an increase in the demand for a security (buyers take over). How do we know this? By identifying this reaction to this price level in the chart's history...
Daily Market Commentary
Updated Friday, 10/6 for Monday's market | Key DOW Levels for 10/9 |
| UP | Above 11,900 |
| DN | Below 11,800
|
Consolidating...
- Dow trades sideways throughout session, continues development of consolidation. The index lost just 16 points for the day, but continues to hold firmly within the boundaries of a tight consolidation that has formed from 11,800 to 11,875.
- The NASDAQ and S&P each traded sideways throughout the session to end the day slightly lower. Look for more range movement ahead of the next breakout move.
Summary
The Dow ended the day quietly lower after trading sideways throughout the session. The index continues to build out a tight consolidation at the highs, which could spark the next key breakout move. Watch this range closely Monday.
Read More...


