Friday, June 16, 2006
Technical Indicators
Average True Range (ATR)
Read More...Average True Range or ATR is a measurement of volatility. It measures the average of true price ranges over time. The True Range is the greatest distance between today's high to today's low, yesterday's close to today's high, or yesterday's close to today's low. The Average True Range is a moving average of the True Ranges.
High ATR values often occur at market bottoms following a "panic" sell-off. Low Average True Range values are often found during extended sideways movement, like as those found at market tops or after consolidation periods. True Range is used in Welles Wilder's Directional Movement indicator as well as Donald Mart's Master Trading Formula and is a common volatility ratio. The ATR can be used in a channel breakout method of trading by adding or subtracting from the previous bar's close or the current bar's open.
High ATR values often occur at market bottoms following a "panic" sell-off. Low Average True Range values are often found during extended sideways movement, like as those found at market tops or after consolidation periods. True Range is used in Welles Wilder's Directional Movement indicator as well as Donald Mart's Master Trading Formula and is a common volatility ratio. The ATR can be used in a channel breakout method of trading by adding or subtracting from the previous bar's close or the current bar's open.
NASDAQ Chart of the Day
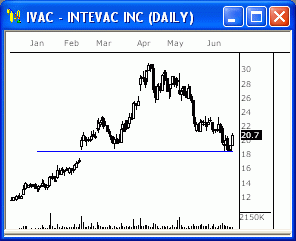 IVAC has gotten a nice bounce off the key 18.50 support level, which has held since February. Watch this level closely for continued reaction.
Daily Trading Signals
NYSE Chart of the Day
Daily Trading Signals
IVAC has gotten a nice bounce off the key 18.50 support level, which has held since February. Watch this level closely for continued reaction.Daily Trading Signals
NYSE Chart of the Day
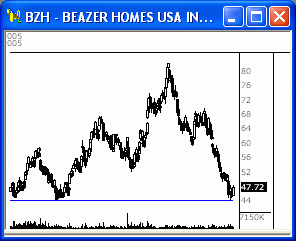
BZH has finally hit a major support level at $44.00 after dropping steadily from the $80 range. Watch this support level closely, as a break or bounce could influence the next big move.
Daily Trading Signals
Daily Market Commentary
Updated Thursday, 6/15 for Friday's market
Mega Rally
Read More...
Updated Thursday, 6/15 for Friday's market
| Key DOW Levels for 6/16 | |
| UP | Above 11,050 |
| DN | Below 10,850 |
Mega Rally
- Dow breaks through 10,850, rallies a whopping 200 points for the day.
- The S&P and NASDAQ closed the day with a solid advance after breaking near-term upper trend lines. Look for a potential reaction at the major upper trend lines tomorrow.
Summary
The Dow closed the day with huge gain after rallying steadily from yesterday's lows to today's Close. The index is now holding just beneath a major upper trend line, which will definitely be a key player in the next move. Watch 11,050 for continued overall strength.
Thursday, June 15, 2006
Moving Average Crossovers
Read More...
Moving averages emit vital market data, but all of them exhibit one common limitation: They lag current events. By the time a 20-bar average curves upward to confirm a trend, the move is already underway and may even be over. While faster incarnations (such as exponential averages) will speed up signals, all of them ring the trading bell way too late.
Multiple moving averages overcome many flaws of the single variety. They're especially powerful when used in conjunction with price patterns. For example, pick out a long-term and a short-term average. Then watch price action when the averages turn toward each other and cross over. This event may trigger a good trading signal, especially when it converges with a key support or resistance level...
Multiple moving averages overcome many flaws of the single variety. They're especially powerful when used in conjunction with price patterns. For example, pick out a long-term and a short-term average. Then watch price action when the averages turn toward each other and cross over. This event may trigger a good trading signal, especially when it converges with a key support or resistance level...
Read More...
Technical Indicators
MACD Histogram
Read More...Signals from the MACD Indicator can tend to lag behind price movements. The MACD Histogram is an attempt to address this situation showing the divergence between the MACD and its reference line (the 9-day Exponential Moving Average) by normalizing the reference line to zero. As a result, the histogram signals can show trend changes well in advance of the normal MACD signal.
A buy signal is generated as the histogram crosses above the zero point. A sell signal is generated as the histogram crosses below zero.
A buy signal is generated as the histogram crosses above the zero point. A sell signal is generated as the histogram crosses below zero.
Daily Market Commentary
Updated Wednesday, 6/14 for Thursday's market
Late-Day Strenght
Read More...
Updated Wednesday, 6/14 for Thursday's market
| Key DOW Levels for 6/15 | |
| UP | Above 10,850 |
| DN | Below 10,715 |
Late-Day Strenght
- Dow swings back and forth throughout the session, but rallies nicely to the Close.
- The S&P and NASDAQ each trailed slowly lower before popping late in the day. Keep an eye on on the clear upper trend lines, as they could lead to a nice intraday rally tomorrow.
Summary
The Dow closed the day with a nice rally to end the session with a nice 111 point gain. The index has now gotten an upside break through the steep upper trend line, which could spark a nice reaction rally after the steady decline. Watch 10,850 and 10,725 for early signs of key movement.
NASDAQ Chart of the Day

Daily Trading Signals
NYSE Chart of the Day
Daily Trading Signals
NGAS has formed a large triangle consolidation at the lows of the recent overall decline. Watch this range for a solid breakout for the next big move: 7.20 down, and 8.40 up.
Daily Trading Signals
NYSE Chart of the Day
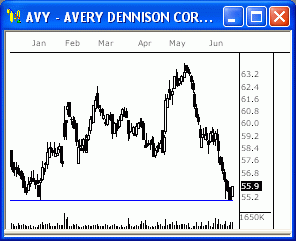
AVY is holding at support at 55.00. This could be a nice bounce zone for this stock, unless 55.00 is solidly broken.
Daily Trading Signals
Wednesday, June 14, 2006
NYSE Chart of the Day

Daily Trading Signals
WMI is getting a solid downside break from a large consolidation at 35.00. Look for a steady downside continuation from this pattern.
Daily Trading Signals
NASDAQ Chart of the Day

Daily Trading Signals
TRLG has just filled a gap to the downside, which is very bearish. This exhaustion gap could lead to much more weakness ahead.
Daily Trading Signals
Updated Tuesday, 6/13 for Wednesday's market
Volatile Decline
Read More...
| Key DOW Levels for 6/14 | |
| UP | Above 10,825 |
| DN | Below 10,650 |
Volatile Decline
- Dow trades back and forth in wild swings, closes session at lows.
- The S&P and NASDAQ rode a big wave of volatility lower today, with each closing near the lows of the session. Look for signs of a possible bounce tomorrow.
Summary
The Dow closed the day at the lows of the session after a highly volatile session. The index will likely continue to trend steadily lower, but could get upside relief upon a break of the clear upper trend line at 10,825. Watch this zone closely tomorrow.
Tuesday, June 13, 2006
Technical Indicators
Chaikin Money Flow
Read More...Developed by Marc Chaikin, the Chaikin Money Flow compares total volume to the closing price and the daily highs and lows to determine how many issues are bought and sold of a particular security. It is based upon the assumption that a bullish stock will have a relatively high close price within its daily range and have increasing volume. However, if a stock consistently closed with a relatively low close price within its daily range with high volume, this would be indicative of a weak security. There is pressure to buy when a stock closes in the upper half of a period's range and there is selling pressure when a stock closes in the lower half of the period's trading range. Of course, the exact number of periods for the indicator should be varied according to the sensitivity sought and the time horizon of individual investor.
Exploring Market Physics
Read More...
The swing trader faces a considerable challenge mastering the puzzle of market movement. While most of us recognize conflict and resolution within the price chart, we fail to utilize these dependable mechanics in our trading strategies. Fortunately, repeating elements of the charting landscape offer a powerful context to understand and manage these vital aspects of trend development. Through repeating dynamics of crowd behavior, price action tends to mimic classic rules that modern scientists apply to our physical universe.
This is probably no accident of nature. Emotion and mathematics interact continuously while they draw the Fibonacci retracements that we see every day through our chart analysis. This fascinating relationship offers a glimpse into the profound order beneath common price movement. At its core, convergence-divergence between these two forces helps us to understand and trade the market swing. For example, we may search the chart for a reversal or breakout pattern that spells opportunity, but we also watch the ticker tape to gauge the crowd's emotional intensity, and to predict where it will burn out or shift gears.
Successful traders draw intuitively upon these bilateral market mechanics as they master the art of speculation. Their advanced skills correspond with the peculiar logic required to unify left and right brain functions into a focused trading methodology. Perhaps future technicians will quantify these profound interactions between herd behavior and physical law, and even open up a new branch of technical price prediction. In the meantime, let's explore some primary characteristics of these underlying market physics...
Read More...
NASDAQ Chart of the Day
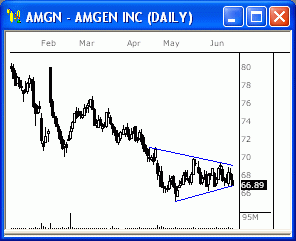
AMGN has formed a clear consolidation at the lows after a steady decline since February. A downside break from this range at 66.50 could make for quite a decline.
Daily Trading Signals
NYSE Chart of the Day

Daily Trading Signals
KO has formed a clear head-and-shoulders pattern at the highs of the latest advance. A downside break through the neck line (support) at 43.05 could send the stock back toward the 40.50 support level.
Daily Trading Signals
Daily Market Commentary
Updated Monday, 6/12 for Tuesday's market
Late-Day Decline
Read More...
Updated Monday, 6/12 for Tuesday's market
| Key DOW Levels for 6/13 | |
| UP | Above 10,900 |
| DN | Below 10,750 |
Late-Day Decline
- Dow breaks triangle to downside, drops steadily late in the day.
- The S&P and NASDAQ each broke free from their respective consolidations today, which sent the indexes tumbling. Look for continued weakness upon a break through prior lows.
Summary
The Dow closed the day with a steady sell-off today after breaking the triangle consolidation to the downside early in the day. Look for continued weakness from this pattern, unless 10,900 is crossed to the upside.
Monday, June 12, 2006
Trading Ideas & Picks
Bullish Stochastics, MACD Signal, Money Flow, Volume...
Bullish Stochastics, MACD Signal, Money Flow, Volume...
CENT declined steadily for over two months. Recently it has begun to show signs that a turnaround is likely:
* The fast stochastic rose above the slow stochastic in oversold territory
* Volume has been strong during the recent rise
* Money flow has been rising over the past several months
* The MACD slope is bullish
Trading Picks - Read More* The fast stochastic rose above the slow stochastic in oversold territory
* Volume has been strong during the recent rise
* Money flow has been rising over the past several months
* The MACD slope is bullish
Daily Stock Picks
Bottoming -
June 8:
ADCT ARBX BMHC CATT CHKP CRIS CYCL DEIX ELNK ENTU EPIC ERES GEPT GIVN GMRK HILL HTCH INGN ISSX JRCC MERC MHGC MRCY MSFT MXIM NFLD NHWK NOVL PLAY PWAV SCUR SGEN SPRT STTX SUPG TINY TXRH ULBI UMBF WFII
June 9:
CALP ORCT SCLD VSGN
(Stocks making a 52 WK low but closing higher than they opened)
Oversold Stocks -
June 8:
AMSG GBBK MAPS NFLX NVLS PRGS SCHW VSEA
June 9:
CHNR INSP RARE SAPE SGEN STTX STXS
(Stocks closing higher than they opened, crossing up through their 25 Stochastic level, and on 150% + greater than average 6 month volume)
Overreaction -
June 8:
JOSB MATR PARL SCLD TGAL
June 9:
BDAY PARL POZN
(Potential Bullish Bounce: Stocks making a 52 WK low and moving down 10% or more in one day)
More... Stock Picks Page #1
NASDAQ Chart of the Day

Daily Trading Signals
ISRG has formed a very large triangle range at the highs of a steady uptrend. A breakout from this triangle could produce a stellar move in the 20 to 40 point range over the course of several months. Watch 105.50 down, and 120.00 for movement.
Daily Trading Signals
NYSE Chart of the Day
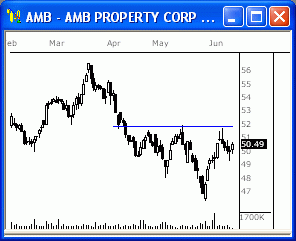
AMB has formed a large inverted head-and-shoulders pattern with a solid neck line resistance level at 52.00. An upside break through this resistance level could shoot this stock back up to prior highs.
Daily Trading Signals
AMB has formed a large inverted head-and-shoulders pattern with a solid neck line resistance level at 52.00. An upside break through this resistance level could shoot this stock back up to prior highs.
Daily Trading Signals
Daily Market Commentary
Updated Friday, 6/9 for Monday's market
Winding Up..
Read More...
Updated Friday, 6/9 for Monday's market
| Key DOW Levels for 6/12 | |
| UP | Above 10,950 |
| DN | Below 10,850 |
Winding Up..
- Dow trades back and forth throughout session, winds up within potent pattern.
- The S&P and NASDAQ each sold off from early strength today to close the day lower. Each index has formed clear triangle that is highly coiled and could provide big movement next week.
Summary
The Dow closed the day within the boundaries of a tightly-wound triangle range, which could provide a big wave of movement early next week. Watch this pattern closely for a breakout Monday; 10,950 up and 10,850 down.
![]()