Friday, June 30, 2006
Stormchaser Technologies
StormChaser Technologies Systems
Read More...Stormchaser Technologies is an Automated Trading Systems Solutions Provider for Active Traders, Hedge Funds and Broker-Dealers. Whether you need to scan through a large universe of symbols, to back-test your trading system against historical data, or to implement multiple Black Box Trading Systems, Stormchaser Technologies has the solution for you!...
Daily Market Commentary
Updated Thursday, 6/29 for Friday's market
Huge Rally
Read More...
Updated Thursday, 6/29 for Friday's market
| Key DOW Levels for 6/30 | |
| UP | Above 11,300 |
| DN | Below 11,025 |
Huge Rally
- Dow breaks triangle to upside, rallies for huge gains.
- The S&P and NASDAQ each opened strong this morning, but finished even stronger. Key patterns were broken to the upside, which could field an more strength ahead.
Summary
The Dow closed the day with a huge gain today after blow through the top of the large triangle range. The index is now in a good position to continue pushing higher still. Look for continued overall strength above 11,000.
NASDAQ Chart of the Day

Daily Trading Signals
FLEX is getting a solid upside break through a clear upper trend line at 10.25, which is very bullish. Watch for continued upside strength from here.
Daily Trading Signals
NYSE Chart of the Day

Daily Trading Signals
FD is holding at the neck line of a very bullish inverted head-and-shoulers pattern. An puside break through the neck line could spark big rally through the May highs. Watch 37.00 for strength.
Daily Trading Signals
Technical Indicators
Accumulation/Distribution Line
Read More...The Accumulation/Distribution Line was developed by Marc Chaikin to assess the cumulative flow of money into and out of a security. He decided to focus on the price action for a given period (day, week, month) and derived a formula to calculate a value based on the location of the close, relative to the range for the period. This is the "Close Location Value" or CLV. The CLV ranges from plus one to minus one with the center point at zero.
The signals for the Accumulation/Distribution Line are fairly straightforward and involve divergence or confirmation. A bullish signal is given when the Accumulation/Distribution Line forms a positive divergence. Be wary of weak positive divergences that fail to make higher reaction highs. A two-week positive divergence should be suspect. However, a multi-month positive divergence deserves serious attention...
The signals for the Accumulation/Distribution Line are fairly straightforward and involve divergence or confirmation. A bullish signal is given when the Accumulation/Distribution Line forms a positive divergence. Be wary of weak positive divergences that fail to make higher reaction highs. A two-week positive divergence should be suspect. However, a multi-month positive divergence deserves serious attention...
Thursday, June 29, 2006
Pattern Cycles: Breakouts
Read More...
Significant declines evolve into long bottoms characterized by failed rallies and retesting of prior lows. As new accumulation slowly shakes out the last crowd of losers, a stock's character changes. Prices push toward the top of key resistance. Short-term relative strength improves and the chart exhibits a series of bullish price bars with closing ticks near their highs. Finally the issue begins a steady march through the wall marked with past failures.
Stocks must overcome gravity to enter new uptrends. Value players build bases but can't supply the critical force needed to fuel rallies. Fortunately, the momentum crowd arrives just in time to fill this chore. As a stock slowly rises above resistance, greed rings a loud bell and these growth players jump in all at the same time...
Stocks must overcome gravity to enter new uptrends. Value players build bases but can't supply the critical force needed to fuel rallies. Fortunately, the momentum crowd arrives just in time to fill this chore. As a stock slowly rises above resistance, greed rings a loud bell and these growth players jump in all at the same time...
Read More...
NASDAQ Chart of the Day

Daily Trading Signals
TEVA has sold off heavily from the May highs, but has pulled back from lows on high volume, forming a possible volume climax. Watch for strength through 33.00 for a solid upside reversal.
Daily Trading Signals
NYSE Chart of the Day

Daily Trading Signals
AMT has formed a clear triangle consolidation after dropping from highs in May. This consolidation looks to be the right shoulder of a large head-and-shoulders pattern, which is a highly bearish pattern. A downside break could lead to big weakness, but also keep an eye on the upper boundary for strength through the top. Watch 31.00 up, and 29.00 down.
Daily Trading Signals
Daily Market Commentary
Updated Wednesday, 6/28 for Thursday's market
Late-day Advance
Read More...
Updated Wednesday, 6/28 for Thursday's market
| Key DOW Levels for 6/29 | |
| UP | Above 11,100 |
| DN | Below 10,900 |
Late-day Advance
- Dow drags early, but rallies steadily to the Close.
- The S&P and NASDAQ each pushed slowly lower throughout the session, but rallies solidly to the Close. Each index continues to wind up for the big breakout move.
Summary
The Dow ended the day with a nice bounce to the Close, but continues to wind up within the boundaries of the large triangle range, which will definitely pack some punch once a breakout occurs. Continue to watch 10,900 for another round of weakness.
Wednesday, June 28, 2006
Daily Stock Picks
Bottoming -
June 27:
TTWO
(Stocks making a 52 WK low but closing higher than they opened)
Oversold Stocks -
June 27:
CYTR NRGY
(Stocks closing higher than they opened, crossing up through their 25 Stochastic level, and on 150% + greater than average 6 month volume)
Overreaction -
June 27:
ARTXD CNCT IRSN OSCI TTWO WRSP
(Potential Bullish Bounce: Stocks making a 52 WK low and moving down 10% or more in one day)
More... Stock Picks Page #1
Daily Market Commentary
Updated Tuesday, 6/27 for Wednesday's market
Steady Decline
Read More...
Updated Tuesday, 6/27 for Wednesday's market
| Key DOW Levels for 6/28 | |
| UP | Above 11,100 |
| DN | Below 10,900 |
Steady Decline
- Dow sells off from early highs, drops steadily to the Close.
- The S&P and NASDAQ each broke key patterns to the downside en route to steady weakness today. Look for continuation patterns to form ahead of the next key move.
Summary
The Dow closed the day with a steady decline and could be on its way to another sharp sell-off within the overall downtrend. Look for continued overall weakness beneath 11,100, unless this level can be broken and held. Further weakness should be seen beneath 10,900.
NASDAQ Chart of the Day

Daily Trading Signals
NTES is showing an initial bearish reaction to a major upper trend line at 22.80. Look for a steady downside reversal from the upper trend line, unless the upper trend line is solidly broken at 22.80.
Daily Trading Signals
NYSE Chart of the Day
Daily Trading Signals
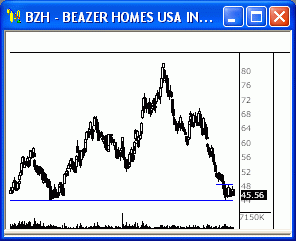
BZH has formed very tight consolidation just above major support from 44.00 to 48.50. A breakout from this consolidation will likely drive either a break or bounce of the major support level. Watch this zone closely for the next big move.
Daily Trading Signals
Technical Indicators
Detrended Price Oscillator
Read More...The Detrended Price Oscillator is a tool that smoothes the trend in prices, allowing you to more easily identify cycles and overbought/oversold levels.
If you think of long-term cycles as made up of a series of short-term cycles, then analyzing these shorter term components can be helpful in identifying major turning points...
If you think of long-term cycles as made up of a series of short-term cycles, then analyzing these shorter term components can be helpful in identifying major turning points...
Tuesday, June 27, 2006
NASDAQ Chart of the Day

Daily Trading Signals
PPCO took a large gap up on high volume, creating a volume climax scenario. A break below 21.40 could cause this stock to fill the large gap back at 16.00.
Daily Trading Signals
NYSE Chart of the Day

Daily Trading Signals
KSS is holding at major resistance at 58.80, which has held for many months. Any signs of weakness in this zone could send this stock back toward this year's lows.
Daily Trading Signals
Daily Market Commentary
Updated Monday, 6/26 for Tuesday's market
Late-day Advance
Read More...
Updated Monday, 6/26 for Tuesday's market
| Key DOW Levels for 6/27 | |
| UP | Above 11,100 |
| DN | Below 10,950 |
Late-day Advance
- Dow holds throughout session, rises to the Close.
- The S&P and NASDAQ each traded quietly today, but the tech-heavy index fell behind on the late-day rally to the Close by the S&P. Each index continues to wind up within their respective ranges, which could offer big breakout potential.
Summary
The Dow closed the day with a nice late-day rally to the Close, but continues to hold at the center of the large triangle that continues to develop in the 60 Minute Chart. Watch for a solid breakout from this range for key medium-to-long term direction.
Monday, June 26, 2006
NASDAQ Chart of the Day
Daily Trading Signals
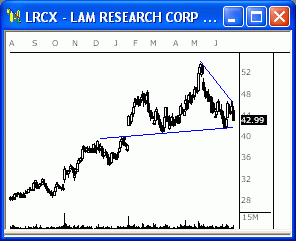
LRCX has formed a huge triangle range at the highs of the steady advance from last year. A breakout from this range could be huge. Watch 47.00 up and 41.00 down.
Daily Trading Signals
NYSE Chart of the Day

Daily Trading Signals
COL has reversed sharply on a light volume climax and is now consolidating at the highs at the neck line of a very bullish inverted head-and-shoulders pattern. An upside break through 55.00 could send this stock back up to the highs near 60.00.
Daily Trading Signals
Daily Market Commentary
Updated Friday, 6/23 for Monday's market
Winding Up...
Read More...
Updated Friday, 6/23 for Monday's market
| Key DOW Levels for 6/26 | |
| UP | Above 11,075 |
| DN | Below 10,950 |
Winding Up...
- Dow trades sideways throughout session, forms key triangle at highs.
- The S&P and NASDAQ each traded mostly sideways today and continue to build out within the boundaries of potentially powerful patterns. Watch the triangle ranges for key movement.
Summary
The Dow closed the day with a modest loss, but is winding up within the boundaries of a very clear and solid triangle consolidation that could make for a big week next week. Watch 11,075 and 10,950 for a solid breakout for the next key move.
Technical Indicators
TRIX - Triple Exponential Moving Average
Read More...The Triple Exponential Moving Average (TRIX) is an oscillator used to identify oversold and overbought markets as well as a momentum indicator. For use as an oscillator look for a positive value to indicate an overbought market and a negative value indicate an oversold market. When TRIX is used as a momentum indicator, a positive value suggests increasing momentum just as a negative value suggests momentum is decreasing. Some believe that the TRIX crossing above the zero line is a buy signal and a closing below the zero line is a sell signal. Divergence between price and TRIX can also indicate significant turning points in the market.
Two advantages of TRIX over other trend indicators is its filtration of market noise and a tendency to be a leading rather than a lagging indicator. By using triple exponential smoothing, "insignificant" cycles are filtered out. It can lead a market because it measures the difference between each bar's smoothed version of the price information. When used as a leading indicator, TRIX is best used in conjunction with another market-timing indicator so as to reduce false signals...
Two advantages of TRIX over other trend indicators is its filtration of market noise and a tendency to be a leading rather than a lagging indicator. By using triple exponential smoothing, "insignificant" cycles are filtered out. It can lead a market because it measures the difference between each bar's smoothed version of the price information. When used as a leading indicator, TRIX is best used in conjunction with another market-timing indicator so as to reduce false signals...
![]()