Thursday, September 28, 2006
Trading Signals of the Day
Bullish Reversal Triggers
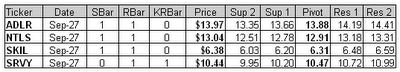
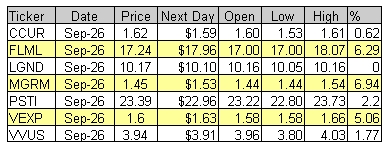
Reversal bars are an objective technique used to time the entry of a trade. Read More... http://daily-stocks.netfirms.com/daily-trading-triggers.htm
Trading Ideas & Picks
Trading Picks - Read More
SIRF: Setting up nicely for a continuation of its current downtrend. Stock broke through support of a recent sideways trading range, and has since consolidatet creating a possible setup for further downside. Look to go short at...
Technical Indicators
Ultimate Oscillator
Read More...Developed by Larry Williams, the Ultimate Oscillator combines a stock's price action during three different time frames into one bounded oscillator. The three time frames represent short, intermediate, and long term market cycles (7, 14, & 28-period). Note that these time periods all overlap, the 28-period time frame includes both the 14-period time frame and the 7-period time frame. This means that the action of the shortest time frame is included in the calculation three times and has a magnified impact on the results.
It is expressed as a single line plotted on a vertical range valued between 0 and 100, with oversold territory below 30 and overbought territory above 70...
It is expressed as a single line plotted on a vertical range valued between 0 and 100, with oversold territory below 30 and overbought territory above 70...
Trading Ideas & Picks
Trading Picks - Read More
HUI: Long-term head and shoulders pattern was forming on the weekly chart of the Gold Bugs Index. The price has fallen from $347 down toward the neckline of the pattern...
DELL: move higher sent the price above the resistance of a descending trendline. The advance above the dotted resistance may suggest that the selling preassure we've seen over the last twelve months is decreasing...
Trading Ideas & Picks
Trading Ideas - Read More
At this point, our poor NDX is being dragged by the nose. No one wants to be short when the INDU breaks its highs. CNBC will throw a big party and the tide will probably raise all boats. I think that is what people are afraid of now and the reason for the market acting weird...
Trading Ideas - Read More
Trading Ideas & Picks
Trading Ideas - Read More
SPX: A break into new highs on this index is good, as is the close near the high of the day. Hopefully the Rising Wedge that you see here does not play a role as a break above the Wedge is a technical sell...
Trading Ideas - Read More
NASDAQ Chart of the Day
AVID has taken a huge breakaway gap down on high volume, which could lead to huge selling ahead. Look for continued overall weakness from this stock so long as it continues to hold beneath 40.00.
Daily Trading Signals
AVID has taken a huge breakaway gap down on high volume, which could lead to huge selling ahead. Look for continued overall weakness from this stock so long as it continues to hold beneath 40.00.
Daily Trading Signals
NYSE Chart of the Day
F has formed a highly bearish head-and-shoulders pattern that could send the stock back toward the summer's lows. A downside break through the neck line at 7.60 could lead to huge selling. Otherwise, watch 8.60 for another shot at strength.
Daily Trading Signals
F has formed a highly bearish head-and-shoulders pattern that could send the stock back toward the summer's lows. A downside break through the neck line at 7.60 could lead to huge selling. Otherwise, watch 8.60 for another shot at strength.
Daily Trading Signals
Daily Market Commentary
Updated Wednesday, 9/27 for Thursday's market
Holding...
Read More...
Updated Wednesday, 9/27 for Thursday's market
| Key DOW Levels for 9/28 | |
| UP | Above 11,750 |
| DN | Below 11,650 |
Holding...
- Dow closes at multi-year highs, holds firmly above 11,650. The index basically held its ground throughout the session and tacked on 22 points by the end of the day.
- The NASDAQ was a bit reserved today, while the S&P mirrored the Dow's gains to the Close. Each index continues to push steadily higher, but could use the help of a continuation pattern.
Summary
The Dow ended the day with a quiet gain today, but was able to hold on to recent overall gains and remain above 11,650. Look for the index to continue to build out at the highs, as it builds toward its next breakout move.
Read More...
Trading Education Tutorial
Island Reversals

Stand Alone Formation Speaks Volumes
Read More...
Island Reversals
Stand Alone Formation Speaks Volumes
Reversals tend to occur slowly, with securities forming double bottoms, higher lows, head and shoulders patterns, etc. before starting a new trend. However, sometimes we see a dramatic reversal immediately, and one of the best indications of these types of reversals is Island Tops and Bottoms.
Read More...
Trading Signals of the Day
Bullish Reversal Triggers


Reversal bars are an objective technique used to time the entry of a trade. Read More... http://daily-stocks.netfirms.com/daily-trading-triggers.htm
Wednesday, September 27, 2006
Trading Ideas & Picks
Trading Ideas - Read More
STX HUM: Stock Picks - Daily Long (STX HUM) and Short (ALKS KR FDC) Potential Swing Candidates ... SwingTracker Scans...
Trading Ideas - Read More
Trading Ideas & Picks
Trading Ideas - Read More
RIMM: This stock is ready to break into new highs and might just do that on earnings that are due out this Thursday. While new highs is a technical buy point, I would be careful as this stock has already had a very big run off the lows. See chart for addtional notes...
Trading Ideas - Read More
Trading Ideas & Picks
Trading Ideas - Read More
BDC: TAfter a breakout this stock is vacilating and holding its breakout trendline as it should. Stops would be at $36. See prior notes on chart...
Trading Ideas - Read More
NASDAQ Chart of the Day

Daily Trading Signals
PHRM took a large gap up yesterday, but has pulled back sharply from the highs on today's trading, leaving the door open to a potential volume climax. A break back below 20.50 could spark a solid volume climax reversal to close the gap.
Daily Trading Signals
NYSE Chart of the Day
Daily Trading Signals
OXY is beginning to show life off of key support at 44.20. An upside break through 47.00 could send the stock rising back toward the summer's highs.
Daily Trading Signals
Daily Market Commentary
Updated Tuesday, 9/26 for Wednesday's market
Bullish Continuation
Read More...
Updated Tuesday, 9/26 for Wednesday's market
| Key DOW Levels for 9/27 | |
| UP | Above 11,700 |
| DN | Below 11,580 |
Bullish Continuation
- Dow resumes steady advance, breaks through key 11,650 level. The index finally got a solid break through major resistance at 11,650 and eventually closed the day with a nice 94 point gain.
- The NASDAQ and S&P each closed the day at the highs of the session, but the tech-heavy index was much more reluctant to breakout to new highs, which could weigh on the market tomorrow.
Summary
The Dow closed the day with a solid gain after chugging higher throughout the session. The index is now at the highs of the year and could be headed higher. However, if the index cannot convincingly rise and hold above 11,700, we could see a near-term retracement first.
Read More...
Trading Education Tutorial
Fibonacci Retracement Levels
Using Retracement Levels in Your Trading
Read More...
Fibonacci Retracement Levels
Using Retracement Levels in Your Trading
Leonardo Fibonacci da Pisa was a thirteenth century mathematician who (re) discovered what is today known as the Fibonacci sequence. Adding 1+1 and then continuing to add the sum to the previous number will arrive at this numerical sequence. The sequence gives rise to the following numbers: 1, 1, 2, 3, 5, 8, 13, 21, 34, 55 and so on.
Read More...
Tuesday, September 26, 2006
Trading Signals of the Day
Bullish Reversal Triggers


Reversal bars are an objective technique used to time the entry of a trade. Read More... http://daily-stocks.netfirms.com/daily-trading-triggers.htm
NASDAQ Chart of the Day
Daily Trading Signals
FINL is holding at the neck line of a large inverted head-and-shoulders pattern at 12.75. Watch for a break through this resistance level for big strength ahead.
Daily Trading Signals
NYSE Chart of the Day

Daily Trading Signals
CBK is getting a solid upside break through key resistance at 30.00, which is highly bullish following a measured gap. Look for more strength from this stock ahead.
Daily Trading Signals
Technical Indicators
Percentage Volume Oscillator (PVO)
The Percentage Volume Oscillator (PVO) is the percentage difference between two moving averages of volume. Because of its formula, the PVO has a maximum value of +100, but no minimum value. The absolute value is not as important as the direction or the crosses above and below the zero line.
The PVO can be used to identify periods of expanding or contracting volume in three different ways:
· Centerline Crossovers: ...
· Directional Movement: ...
· Moving average crossovers: ...
Movements in the PVO are completely separate from price movements. As such, movements in PVO can correlated with price movements to assess the degree of buying or selling pressure. Advances combined with strength in the PVO would be considered strong. Should the PVO decline while a security's price fell, it would indicate decreasing volume on the decline.
Read More...The Percentage Volume Oscillator (PVO) is the percentage difference between two moving averages of volume. Because of its formula, the PVO has a maximum value of +100, but no minimum value. The absolute value is not as important as the direction or the crosses above and below the zero line.
The PVO can be used to identify periods of expanding or contracting volume in three different ways:
· Centerline Crossovers: ...
· Moving average crossovers: ...
Movements in the PVO are completely separate from price movements. As such, movements in PVO can correlated with price movements to assess the degree of buying or selling pressure. Advances combined with strength in the PVO would be considered strong. Should the PVO decline while a security's price fell, it would indicate decreasing volume on the decline.
Daily Market Commentary
Updated Monday, 9/25 for Tuesday's market
Steady Advance
Read More...
Updated Monday, 9/25 for Tuesday's market
| Key DOW Levels for 9/26 | |
| UP | Above 11,650 |
| DN | Below 11,470 |
Steady Advance
- Dow reverses from early lows, pushes steadily higher to the Close. The index eventually closed the day with a solid 68 point gain, but continues to hold within a very large trading range that we will continue to monitor.
- The NASDAQ and S&P each rallied sharply from early lows and are now testing key resistance levels. Look for a continuation pattern to indicate that continued strength is likely.
Summary
The Dow ended the day with a solid rally after bouncing near key support early in the day. The index continues to build out within the boundaries of a large trading range, which we will continue to watch closely.
Read More...
Trading Education Tutorial
Moving Averages and the Trend
Moving Averages Help Us Identify Trend Reversals
Read More...
Moving Averages and the Trend
Moving Averages Help Us Identify Trend Reversals
One of the old axioms of technical analysis is that "the trend is your friend". This holds true, as long as you trade in the direction of the trend. However, your 'friend' has two faces, and can turn on you to eliminate profits (and your friendship!). Trend reversals can occur at any time and one of the important skills a trader must possess is the ability to identify a reversal. It is easy to exit a position too early if we over-anticipate a trend reversal, and just as easy to watch our profits evaporate if we are too slow to exit the trade.
Read More...
Trading Tools
Shogun Swing Trading - Best Swing Trading:
Shogun Trading's approach can benefit all stock traders, from day traders to long term swing traders. We are proud to show some of the best Performance in Day Trading, Longer Term Swing Trading Strategy, Systemized Swing Trading and through our Educational Courses and Videos... » Get More Info Now!
Shogun Trading's approach can benefit all stock traders, from day traders to long term swing traders. We are proud to show some of the best Performance in Day Trading, Longer Term Swing Trading Strategy, Systemized Swing Trading and through our Educational Courses and Videos... » Get More Info Now!
Monday, September 25, 2006
Daily Stock Picks
Bottoming -
Sep 22 for Sep 25:
BIOS EXTR FCEL HYGS INSP PBIO RAME TUTS
(Stocks making a 52 WK low but closing higher than they opened)
Oversold Stocks -
Sep 22 for Sep 25:
CMED
(Stocks closing higher than they opened, crossing up through their 25 Stochastic level, and on 150% + greater than average 6 month volume)
Overreaction -
Sep 22 for Sep 25:
AATI ANPI SATC
(Potential Bullish Bounce: Stocks making a 52 WK low and moving down 10% or more in one day)
More... Stock Picks Page #1
Trading Ideas & Picks
Trading Ideas - Read More
Any pull back at this point is still bound to stay within the trading channel that is on the daily basis chart, which means not much potential. A break to the upside, however, has more potential since it is in the direction of the overall trend. If the NDX breaks below the 1615 level after bouncing back up, it will complete a top and we will have a quick pull back...
Trading Ideas - Read More
Trading Ideas & Picks
Trading Picks - Read More
QQQQ: Friday's decline sent the QQQQ back below the 200 DMA, which may be an early indication that we could see a more significant pullback. We'll continue to watch the $40 level as traders figure out if they want to push the index higher or lower from here...
Daily Market Commentary
Updated Friday, 9/22 for Monday's market
Holding at Support
Read More...
Updated Friday, 9/22 for Monday's market
| Key DOW Levels for 9/25 | |
| UP | Above 11,650 |
| DN | Below 11,470 |
Holding at Support
- Dow tests key support at 11,480, holds to the Close. The attempt to break the key 11,480 support level failed, thus causing the index to basically trade sideways to the Close for a relatively mild 25 point loss.
- The NASDAQ and S&P each sold off today, but held at lows throughout the day above key near-term support levels. Look for more development around these levels until a solid breakout is seen.
Summary
The Dow closed the day quietly, as the index basically traded sideways to the Close above the key 11,480 support level. Look for the index to continue to trade around this fulcrum until a decisive break away from this level is seen.
Read More...
Trading Education Tutorial
Consolidations
Sideways Movement Gives Indication of Future Price Direction
Read More...
Consolidations
Sideways Movement Gives Indication of Future Price Direction
A consolidation is a place where buyers and sellers are very closely matched in numbers. As the battle ensues, others notice that the market is consolidating, and begin considering to get on board. As soon as a break from the consolidation occurs, the latent buyers or sellers usually begin taking positions.
Read More...
NASDAQ Chart of the Day

Daily Trading Signals
PDLI has formed a large, bullish saucer bottom and could really push to new highs if 20.00 is solidly crossed. Watch this level for signs of big strength. However, if this stock falls beow 17.00, this pattern will be broken and it could unleash more selling.
Daily Trading Signals
NYSE Chart of the Day
Daily Trading Signals
AXP has gotten another big reaction to the major 55.00 resistance level that has held for many months. If the stock cannot rise confidently above this resistance level, we could see big selling away from it once again.
Daily Trading Signals
Trading Ideas & Picks
Trading Picks - Read More
PD: Stock is in the process of testing a 13-month trendline. The ascending trendline has prevented the price from heading lower in the past and it will be interesting to see if this time will be any different...
Trading Ideas & Picks
Trading Ideas - Read More
ICE: This stock might try to turn up at anytime and if it does then this would create a nice looking Bull Flag. Buy point is when the stock clears the upper trendline...
Trading Ideas - Read More
![]()