Friday, November 10, 2006
| Market Announcement That Will Affect the Way You Trade Forever...
There's so much news thrown at us every day, it's hard to filter out the important from the inane. This is especially true with the markets - turn on any news channel and you get your choice of the talking heads telling you why they're right ;-)
Anyway, there IS one big recent announcement regarding the markets that you should be aware of. It's a major development for the U.S. stock market.
The options experts at Options University are all over this and have recorded a special trading video that reveals the importance of this recent development.
Watch this 11-minute trading video now. Every other trader will eventually understand the importance of this development, so the earlier you understand it, the better.
The BIGGEST and most EXCITING trend to hit the markets in decades – courtesy of the NASDAQ!
CLICK to See the Video NOW!
| | Do you like change? Or are you comfy the way things are.
Because this video is going to do one of two things...
It should either get you really excited... or, it should frustrate the heck out of you because of this upcoming change to the stock market.
Regardless of how you feel, this change could have a profound impact on how you trade.
Here's the top of an email Brett Fogle & Ron Ianieri from the Options Unversity sent me a day or two ago regarding this:
"Stock traders are up in arms, fuming mad at NASDAQ's latest announcement regarding options -- and what it all means to the stock market and your trading (HINT: you may never trade stock again...)."
So, if you're interested in learning about what's going on and how it could affect your trading forever, watch the video here:
CLICK to See the Video NOW! |
| P.S. Ron thinks that fortunes will be made in the next 12 - 18 months with this new information. Only time will tell, of course; but those with the best information usually have a huge edge over those that don't. » Get the info here... | | |
Trading Education Tutorial
Trading Ranges
Big Moves Occur Outside of the Range
A trading range is basically a horizontal channel in which a security moves from the high and low of the channel for an extended amount of time. Obviously, the upper level of the range can be considered resistance and the lower level represents support. Trading within a range is possible, but it's the breakout from the range that provides the best opportunities.
Read More...
NYSE Chart of the Day
ABT has formed a huge saucer top pattern, which is highly bearish. The stock is holding right at the lip (support) of the pattern at 45.90 which, if broken, could spark heavy selling.
Daily Trading Signals
NASDAQ Chart of the Day
GIGM has trended steadily higher for some time now, but could finally be over-extended. The stock got a big, bearish exhaustion gap today and is winding up within a large triangle range. A downside break through 9.00 could be huge for sellers.
Daily Trading Signals
Daily Market Commentary
Updated Thursday, 11/9 for Friday's market. | Key DOW Levels for 11/10 |
| UP | Above 12,200 |
| DN | Below 12,025
|
Steady Decline...
- Dow pushes steadily lower throughout session, holds at key 12,100. The index index trailed lower to the Close and eventually closed the day at the key 12,100 zone with a 73 point loss.
- The NASDAQ and S&P each fell from the day's highs today, but basically held firmly above key near-term support. Watch these support levels tomorrow.
Summary
The Dow ended the day precisely at the 12,100 level today after it steadily declined throughout the session. The index continues to pull-back from the 12,200 resistance level, which could cause a longer retracement, especially if 12,050 is violated.
Read More...
Thursday, November 09, 2006
Trading Ideas & PicksAMZN: The bulls have managed to push the price of the company's shares above a medium-term resistance level. The $39 level has prevented the bulls from pushing the price higher on several occasions over the past eight months, but today's breakout suggests that this story is changing...
Trading Education Tutorial
Fibonacci Retracement Levels
Using Retracement Levels in Your Trading
Leonardo Fibonacci da Pisa was a thirteenth century mathematician who (re) discovered what is today known as the Fibonacci sequence. Adding 1+1 and then continuing to add the sum to the previous number will arrive at this numerical sequence. The sequence gives rise to the following numbers: 1, 1, 2, 3, 5, 8, 13, 21, 34, 55 and so on.
Read More...
NASDAQ Chart of the Day
PEIX has wound up perfectly within the boundaries of a solid triangle pattern. The stock is now testing the upper trend line of the pattern at 17.50 and could get a huge upside break and rally. Watch this pattern closely.
Daily Trading Signals
NYSE Chart of the Day
WPI has gotten a big breakaway gap from a tight consolidation at 25.60, which is quite bearish. Look for continued weakness from this stock.
Daily Trading Signals
Daily Market Commentary
Updated Wednesday, 11/8 for Thursday's market. | Key DOW Levels for 11/9 |
| UP | Above 12,200 |
| DN | Below 12,100
|
Record Close...
- Dow reverses from major trend line, rallies steadily to the Close. The index proceeded to push higher the remainder of the day and eventually closed at another record high at 12,176, which was good for a 20 point gain. The index continues to struggle at 12,200, however, which is the next big level to watch for strength.
- The NASDAQ and S&P each rallied from early lows this morning, but failed to advance above key resistance. Watch the ranges that have formed for the next medium term move.
Summary
The Dow closed the day near the highs of the day to set another record high. However, the 12,200 level continues to hinder further strength. Watch this level for key breakout movement; otherwise, 12,100 could be tested again.
Read More...
Technical IndicatorsRelative Momentum Index (RMI)
Introduced by Roger Altman in the February 1993 issue of Technical Analysis of Stocks & Commodities magazine, the Relative Momentum Index is a variation of the Relative Strength Index (RSI). Instead of counting up and down days from close to close like the RSI, the Relative Momentum Index counts up and down days from the close relative to a close n-days ago (where n is not limited to 1 as required by the RSI).
As with all overbought/oversold indicators, the RMI exhibits similiar strengths and weaknesses. In strong trending markets the RMI will remain at overbought or oversold levels for an extended period. In non-trending markets the RMI tends to predictably oscillate between an overbought level of 70 to 90 and an oversold level of 10 to 30. When the RSI diverges from the price, the price will eventually correct to the direction of the index.
Read More...
NASDAQ Chart of the Day
OMNI is winding up within a large triangle range, which has developed over the last three months. Look for a breakout from this range for big movement: 10.50 up and 8.60 down.
Daily Trading Signals
NYSE Chart of the Day HW
HW has gotten a huge downside break from a clear triangle range at 24.00, which is highly bearish. Look for continued overall weakness from this pattern.
Daily Trading Signals
Daily Market Commentary
Updated Tuesday, 11/7 for Wednesday's market. | Key DOW Levels for 1187 |
| UP | Above 12,200 |
| DN | Below 12,000
|
Steady Continuation...
- Dow reverses from major trend line, rallies steadily to the Close. The index proceeded to trade sideways the remainder of the session and is now holding just beneath key resistance at 12,200.
- The NASDAQ and S&P each rallied to early gains this morning, but fizzled a bit to the Close. Each remains bullish after the current two-day advance, but could be in a consolidation mode before another breakout is seen.
Summary
The Dow ended the day near the highs of the session after halting its advance at 12,200. The index is now consolidating at the highs, which may persist ahead of the next move. The index should remain near-term bullish above 12,100.
Read More...
Tuesday, November 07, 2006
Trading Education Tutorial
Measured and Exhaustion Gaps
 Identifiable Patterns After Confirmation Move
We have previously mentioned the three types of gaps that are of relevance to investors - the breakaway gap, the measured (or continuation) gap, and the exhaustion gap. We previously discussed the breakaway gap, but it is important to discuss the measured gap and exhaustion gap at the same time. Why? Because it is difficult to tell one from the other until after the fact.
Read More...
NASDAQ Chart of the Day
FRNT has formed a tightly-wound triangle consolidation at the highs of the overall advance. Watch for a breakout from this range for key movement: 8.50 up, and 7.80 down.
Daily Trading Signals
NYSE Chart of the Day
AVP has reversed from major resistance at 33.25, which has held firmly since May. Look for a steady decline from this level, unless resistance is crossed and held.
Daily Trading Signals
Daily Market Commentary
Updated Monday, 11/6 for Tuesday's market. | Key DOW Levels for 11/7 |
| UP | Above 12,150 |
| DN | Below 12,000
|
Big Rally...
- Dow reverses from major trend line, rallies steadily to the Close. The major lower trend line, seen in the Daily and 60 Minute Charts continues to be a major force in the highly bullish uptrend, which will remain the 'norm' as long as it remains in tact.
- The NASDAQ and S&P each rallied solidly today, but looked to have tapered off to the Close. Look for each to hold gains tomorrow, as long as intraday support levels remain in tact.
Summary
The Dow closed the day with a solid gain after rallying fiercely at the Open and maintaining the gains to the Close. The index will likely look to hold gains tomorrow, as a potential continuation pattern forms. Look for continued overall strength above 12,050, unless this level is violated.
Read More...
Monday, November 06, 2006
Bullish Reversal Triggers
 Reversal bars are an objective technique used to time the entry of a trade
.
Read More... http://daily-stocks.netfirms.com/daily-trading-triggers.htm
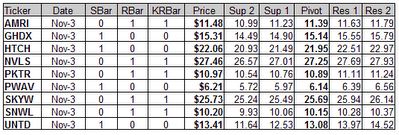
Daily Stock Picks
Bottoming -
Nov 3 for Nov 6:
AVNR CNVR NBIX PXPL RRGB
(Stocks making a 52 WK low but closing higher than they opened)
Oversold Stocks -
Nov 3 for Nov 6:
ANSR ARXX CWST NSTR SCMR UNTD
(Stocks closing higher than they opened, crossing up through their 25 Stochastic level, and on 150% + greater than average 6 month volume)
Overreaction -
Nov 3 for Nov 6:
LOCM NBIX PXPL RRGB WFMI
(Potential Bullish Bounce: Stocks making a 52 WK low and moving down 10% or more in one day)
More...
Stock Picks Page #1
Trading Education Tutorial
Saucer Patterns Rare Pattern Is One of the Most Predictive
One of the most predicitive chart patterns you will come across is the saucer pattern. Saucers are also referred to as "bowls" or even "rounded tops or bottoms", and one look at this pattern tells where these names are derived from. However, there is a problem with saucer patterns - they're hard to find.
Read More...
NASDAQ Chart of the Day
ERTS took a large gap up through major resistance at 58.00 today, and also has increased volume. If the stock can continue to hold above the break zone of 57.80, we could see much more strength ahead.
Daily Trading Signals
NYSE Chart of the Day
IRF has broken a large consolidation to the upside via a solid breakaway gap and increased volume, which is quite bullish. Watch for continued strength from this stock.
Daily Trading Signals
Trading Ideas & PicksSwingTracker Scans: Stock Picks - Long and Short Potential Swing Candidates ... SwingTracker Scans: Trading Window, Force Swings, Triangle, Revival and more...
Trading Ideas & PicksQQQQ: The QQQQ failed to move above the resistance near $43, which we've noted in our past reports as a likely barrier that would prevent the bull rally from continuing. In our last report, we also mentioned that the support of the 15 DMA was able to prevent a major pullback, but this story is no longer relevant because the bulls were unable to prevent a move below this moving average...
Daily Market Commentary
Updated Friday, 11/3 for Monday's market. | Key DOW Levels for 11/6 |
| UP | Above 12,075 |
| DN | Below 11,950
|
Still Drifting...
- Dow continues slow decline, pull backs to major lower trend line. The pull-back continued today and resulted in a 33 point loss in the Dow, but the index has finally reached the major lower trend line at 11,950, which will be the zone to watch next week.
- The NASDAQ and S&P continued their respective declines today, but look to be gearing up for an even larger move next week. Watch support for signs of continued overall weakness.
Summary
The Dow closed the day with another loss today, extending its streak to six days in a row. The index continues to look fairly unorganized in its movement, but has traded precisely to the major lower trend line at 11,950, which we will continue to watch. A break or bounce from this level will likely determine the next major medium term move.
Read More...
