Friday, October 20, 2006
Technical IndicatorsMarket Facilitation Index
Market Facilitation Index synthesizes both price and volume data in an effort to improve trading accuracy. In his book Trading Chaos, Williams identified four types of trading sessions: Fakes, Fades, Squats, and Greens.
The combination of lowered volume with a rising MFI is known as a "Fake." As there is no real foundation for change behind a stock except for market activity on the floor, the price eventually reverses itself.
A "Fade" is when volume is down and the MFI is also down. In essence, the market is bored and interest in the stock fades. Expect the price to move in the opposite direction.
When volume is up while the MFI is down, the condition is referred to as a "Squat." Think of the stock crouching down like a sprinter before a race. Movement after the squat gives a clue to future to direction.
When volume and the MFI are both up, the situation is "Green." This is a strong signal to follow the trendline...
Read More...
Quantum Swing Trader - Limited EditionIf you had a stock trading method that let you discover when a stock was about to make a massive move UP or DOWN, and then showed you, step-by-step, how to take advantage of that move to potentially pull profits out of the markets... would you be interested?
The "sweet spot" of Quantum Swing Trader is that it shows you how to take just a few common indicators, but use them in an uncommon way to "pinpoint" the spot in any stock where it has a high probability of making a massive move UP or DOWN, but not stay the same.
* Quantum Swing Trader - Limited Edition*
Trading Education Tutorial
Triangles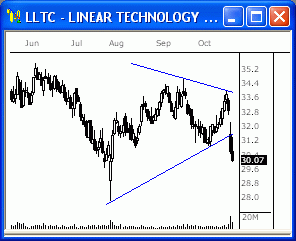 Tightening Price Action Leads to a Breakout
There are various forms of consolidation and they occur anytime there is an equilibrium of buyers and sellers. One of the most predictive consolidation formations is the triangle.
Read More...
NASDAQ Chart of the Day
AVCI is breaking a large head-and-shoulders type pattern to the downside at 7.55, which is bearish. Look for this stock to continue to drop toward the prior gap at about 5.60.
Daily Trading Signals
NYSE Chart of the Day
AMD has gotten a big breakaway gap out of a large triangle range on increased volume, which is quite bearish. Look for continued weakness from this stock.
Daily Trading Signals
Daily Market Commentary
Updated Thursday, 10/19 for Friday's market's market | Key DOW Levels for 10/20 |
| UP | Above 12,050 |
| DN | Below 11,950
|
Above 12,000...
- Dow pushes higher, closes above 12,000 for first time. The index closed the day with a 19 point gain and is now winding up within a very tight triangle type range, as seen in the 15 Mute Chart. A breakout from this range could offer big movement.
- The NASDAQ and S&P each pushed higher at the Open, but closed the day fairly quietly. Each continues to honor just above near-term support and within clear consolidation patterns. Watch these ranges tomorrow.
Summary
The Dow ended the day quietly higher today and is now winding up within the boundaries of a developing triangle consolidation. Look for a breakout from this range for the next key move. A downside break through the major lower trend line at 11,950 could spark heavy selling.
Read More...
Thursday, October 19, 2006
Trading Education Tutorial
Volume Climax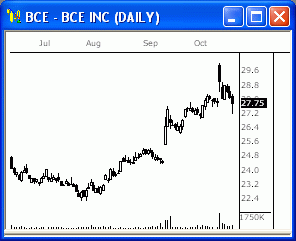 Volume Helps Identify Reversals
Various price patterns can alert us to potential reversal candidates. Trendline Breaks, Support and Resistance Levels, Fibonacci Retracement Levels and other price information are valuable in determining a change in direction for a security. However, one of the most overlooked chart patterns that help us determine reversals is not reflected in the price itself. Volume climaxes are easily identifiable and valuable in assessing a change in market sentiment.
Read More...
Trading Ideas & PicksYHOO: The bears have recently pushed the price below the psychological support of $25 - a level that we'd expect to give the bulls some difficulty when they try to push the price higher again...
NASDAQ Chart of the Day
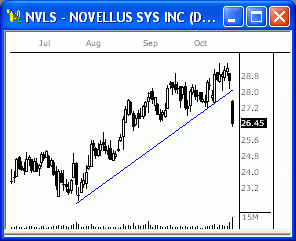
NVLS has broken a clear trend line to the downside via a large gap and high volume, which is quite bearish. Watch for continued weakness from this stock.
Daily Trading Signals
NYSE Chart of the Day
CPB has formed a large saucer top formation at the highs, which is quite bearish. Watch for a break through support at 35.50 for selling pressure to occur.
Daily Trading Signals
Trading Ideas & PicksSRHAT: Setting up nicely for a continuation of its current downtrend. Stock broke past support and to new trend lows, then traded today at the lower end representing a consolidation and possible setup for further downside. Look to go short at 18.92...
Daily Market Commentary
Updated Wednesday, 10/18 for Thursday's market's market | Key DOW Levels for 10/19 |
| UP | Above 12,100 |
| DN | Below 11,925
|
Target Reached..
- Dow reaches all-time highs at 12,000, hits consolidation target as well. The index closed the day calmly lower by just 43 points, but could be gearing up for another big move.
- The NASDAQ and S&P each sold off from early gains today and could be on verge of heading lower. Watch near-term support in the NASDAQ, as this could tell the story tomorrow.
Summary
The Dow closed the day well of the day's highs after setting all-time highs yet again within this overall uptrend. The index looks like it may have topped out now, however. If the index gets a break through the major lower trend line at 11,925, we could see big selling ahead.
Read More...
Wednesday, October 18, 2006
Trading Education Tutorial
Trendlines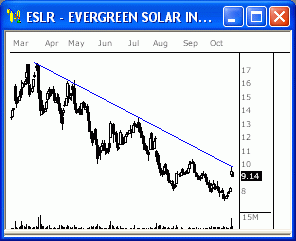 Determining Market Reversals and Continuations
Trendlines are perhaps the oldest tools known to chartists. Trendlines form across peaks and valleys called pivot points - relative highs and lows in a chart. As more points form along a line, it becomes more "established". This means that, when the line is broken, it will likely follow through with a strong move in the new direction.
Read More...
NYSE Chart of the Day

EAT is holding within the boundaries of a very tight consolidation from 39.50 to 42.50. A breakout from this range could spark key movement. Watch it closely.
Daily Trading Signals
NASDAQ Chart of the Day

BRCM has formed a large triangle consolidation at the lows of the key summer decline. Watch for a solid breakout from this range for the next big breakout move: 32.00 up, and 28.00 down.
Daily Trading Signals
Daily Market Commentary
Updated Tuesday, 10/17 for Wednesday's market's market | Key DOW Levels for 10/16 |
| UP | Above 12,000 |
| DN | Below 11,875
|
V-Bottom Reversal
- Dow sells off sharply at Open, but recovers bulk of losses with v-bottom reversal. The index held firmly at 11,900 and eventually rode a solid v-bottom reversal back toward the day's highs for a much smaller 31 point loss for the day.
- The NASDAQ and S&P each sold off heavily to begin the day, but staged impressive recoveries to the Close. Each index could be on the verge of an even greater breakout move soon.
Summary
The Dow ended the day with a modest loss after selling off sharply to begin the session. The index looks to be winding up within a very large consolidation pattern at the highs, which we will continue to watch closely for big movement.
Read More...
Tuesday, October 17, 2006
Technical IndicatorsTrade Volume Index
Similar to the On Balance Volume indicator, the Trade Volume Index (TVI) uses price and volume to show whether a security is being purchased or sold. The On Balance Volume (OBV) method works well with daily prices, but it doesn't work as well with intraday tick prices. The difference between the OBV and the TVI is that the TVI makes use of intraday tick data while the OBV uses of end of day data.
Tick prices, especially stock prices, often display trades at the bid or ask price for extended periods without changing. This creates a flat support or resistance level in the chart. During these periods of unchanging prices, the TVI continues to accumulate this volume on either the buy or sell side, depending on the last price change...
Read More...
| Quantum Swing Trader Limited Edition
If you had a stock trading method that let you discover when a stock was about to make a massive move UP or DOWN, and then showed you, step-by-step, how to take advantage of that move to potentially pull profits out of the markets... would you be interested?
The "sweet spot" of Quantum Swing Trader is that it shows you how to take just a few common indicators, but use them in an uncommon way to "pinpoint" the spot in any stock where it has a high probability of making a massive move UP or DOWN, but not stay the same.
* Quantum Swing Trader - Limited Edition*
This is a big deal, because traders have the potential to make the really big money when the market makes these kinds of moves. And Bill shows you how easy it is to take advantage of these situations, again and again.
Quantum Swing Trader is created by 30+ year trading veteran Bill Poulos. The trading community's been waiting for the re-release of this course since it was announced a few weeks ago, and as of 7:39pm on 10/16, there have been over 37,745 visits to Bill's website from traders hoping to catch a glimpse of his new course.
To sum up Quantum Swing Trader in 3 points:
** The method is deceptively simple, yet profoundly powerful.
** Bill's unique "immersive" teaching style makes it extremely easy and entertaining to learn the method.
** This is one the highest-quality courses I've ever seen on the market. All the audio is crystal-clear, the videos are superb, and the full color manual is a breeze to get through.
Bill's only releasing 200 more copies to the trading community, and only from October 17 through October 24. He's doing this so he can make sure he can provide support and focus to his next group of students for his new course. | |
Well, the doors are now officially open. The NEXT 200 traders can get Quantum Swing Trader here:
Quantum Swing Trader - Limited Edition
This course is HUGE. Heck, the box that it arrived in weighed about 5 or 6 pounds. But Here are some of the highlights that really stood out for me:
** Bill's "Fre e Trade" strategy which is the goal of every trade he teaches you to place. This lets you get into a position and lock in some early profits. Every trade should be like this ;-)
** How to quickly scan over 8,000 stocks every night in seconds with Bill's search criteria to find the stocks that have a high- probability of entering into a potentially profitable position.
** Bill's Profit Feeder service, which "spoon feeds" you his highest-probability stocks every night.
** The 2 "cheat sheet" blueprints that summarize the entire method in one place so you don't need to spend hours hunting through the materials after you've studied it to find what you want.
** Spend no more than 20 minutes a night applying the method.
There's a ton more, including a dedicated section just for beginners, lifetime customer support, and some really unique bonuses, but you'll need to check out his web page to see everything for yourself.
Quantum Swing Trader - Limited Edition
Finally, to make it super easy for you to try out Quantum Swing Trader in your home, Bill is also going to give you a guaranty. So what do you have to lose? Not much. And I believe you have a whole lot to gain.
Here's the link for a letter that Bill wrote giving you all the details. Again, I can't promise this link will work because he may already have sold out Quantum Swing Trader - Limited Edition
| |
Trading Education Tutorial
Breakaway Gaps
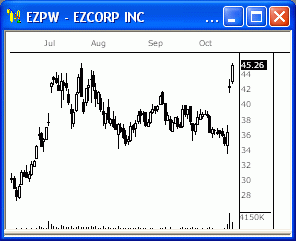 Pressure Helps Identify Movers
Gaps occur when there is a dramatic change in market conditions. They can occur at the beginning of a trading session (i.e. most NASDAQ stocks) or even during the session itself. There are three types of gaps that are of interest to us when we analyze charts: breakaway, measured (also known as continuation) and exhaustion gaps. Today we will discuss the breakaway gap.
Read More...
NASDAQ Chart of the Day
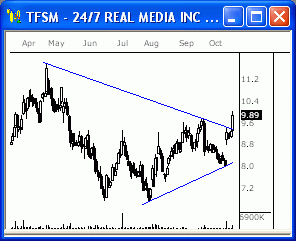
TFSM has gotten a big breakout through the top of the large triangle consolidation at 9.50, which is highly bullish. Look for more strength from this stock to new highs on the year.
Daily Trading Signals
NYSE Chart of the Day
COP has recovered solidly after dipping below a critical support level earlier in the month. This reversal could send the stock back toward the year's highs at around 70.00.
Daily Trading Signals
| NetPicks' Live Webcast
- Over 8,300 downloads of the Myth Busting Video since it's release
- Over 60,000 hits to the blog in the last 5 days
- Hundreds of emails coming in daily, and the phone ringing almost non-stop
This demonstrates a significant interest by traders like you to learn the non subjective, single indicator, quick to learn methodology that just had a 20 day streak of profitable trades. That's a full trading month!
Yet, still no one knows when the Ultimate Trading Machine (UTM) will be available for purchase, no one knows how long it will be available for, and no one knows how many copies will be available (yes, the quantity is limited, and will sell out very quickly.)
Today we announce when you can find out all of these details, and where you can come to see the UTM in action. There will be a live no fee webcast this Thursday, October 19th at 9pm EST (New York Time) or 6pm PST (Pacific Time.) It is very important you attend, as Anthony Trister, along with their chief developer will be in the call, and this will afford you a very rare chance to hear them speak live, and get all your answers directly.
| |
This is where you can reserve your spot:
Ultimate Trading Machine Webcast
Wewbcast will be covering specific information about the system, showing charts on how it trades, the markets it covers, why it is so powerful and just how it can be so accurate, as well as the answers to the other unknown's mentioned above.
There is a void in the marketplace, and the UTM fills it. While most systems are subjective, and often complicated allowing much room for interpretation, mistakes, and varied results, this is not. We all take the same setups, and we all get the same consistent results. In fact, when NetPicks did their internal launch back in August, the demand was so great, the offer was pulled several days early, as the copies simply sold out.
This Thursday, you will find out why. To register for the event go to:
Ultimate Trading Machine Webcast
Space is limited to the first 500 registrants, and it will fill up fast. This is an event you don't want to miss. More details will follow upon registration.
| |
Daily Market Commentary
Updated Monday, 10/16 for Tuesday's market's market | Key DOW Levels for 10/17 |
| UP | Above 12,000 |
| DN | Below 11,900
|
Steady Advance
- Dow pushes modestly higher, closes in on 12,000. The index came within 3 points of hitting the 12,000 level and continues to climb to all-time highs.
- The NASDAQ and S&P each held their own within the current uptrend, but the NASDAQ is beginning to show signs of weakness. Watch near-term support tomorrow.
Summary
The Dow closed the day near the highs of the session after pushing slowly higher throughout the day. The index is approaching 12,000, but could be on the verge of a pull-back if 11,950 cannot hold.
Read More...
Monday, October 16, 2006
Daily Stock Picks
Bottoming -
Oct 13 for Oct 16:
CBMX MSCS YHOO
(Stocks making a 52 WK low but closing higher than they opened)
Oversold Stocks -
Oct 13 for Oct 16:
YHOO
(Stocks closing higher than they opened, crossing up through their 25 Stochastic level, and on 150% + greater than average 6 month volume)
Overreaction -
Oct 13 for Oct 16:
MSCS OVRL SFUN VWPT
(Potential Bullish Bounce: Stocks making a 52 WK low and moving down 10% or more in one day)
More...
Stock Picks Page #1
NASDAQ Chart of the Day

MCRL is getting a big upside break through the top of a large triangle at 10.50, which is quite bullish. Look for continued strength from this stock.
Daily Trading Signals
NYSE Chart of the Day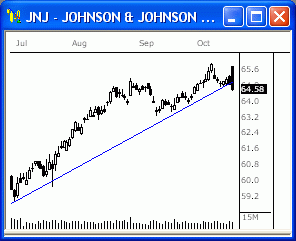
JNJ is getting a big downside break through a clear lower trend line that has remained in tact since the July lows, which is bearish. Also, the stock got a big exhaustion gap today, which further indicates weakness. Watch for selling through 64.25.
Daily Trading Signals
Trading Education Tutorial
Moving Averages and the Trend
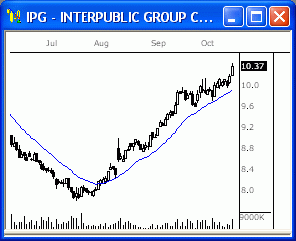 Moving Averages Help Us Identify Trend Reversals
One of the old axioms of technical analysis is that 'the trend is your friend'. This holds true, as long as you trade in the direction of the trend. However, your 'friend' has two faces, and can turn on you to eliminate profits (and your friendship!). Trend reversals can occur at any time and one of the important skills a trader must possess is the ability to identify a reversal. It is easy to exit a position too early if we over-anticipate a trend reversal, and just as easy to watch our profits evaporate if we are too slow to exit the trade.
Read More...
Daily Market Commentary
Updated Friday, 10/13 for Monday's market's market | Key DOW Levels for 10/16 |
| UP | Above 11,975 |
| DN | Below 11,900
|
Late-Day Advance
- Dow rallies from early decline, closes at new highs again. The index eventually closed the day at another all-time high with a modest gain of just 13 points.
- The NASDAQ and S&P each pushed slowly higher throughout the session today to close near the day's highs. Look for continued strength above near-term support.
Summary
The Dow ended the day with a solid advance to Close at the session's highs after beginning the day slowly. The index continues to hold firmly above prior resistance and continues to reach for new highs, which is highly bullish. Look for continued overall strength above 11,900.
Read More...


