Friday, August 04, 2006
Trading Tools
Shogun Swing Trading - Best Swing Trading:
Shogun Trading's approach can benefit all stock traders, from day traders to long term swing traders. We are proud to show some of the best Performance in Day Trading, Longer Term Swing Trading Strategy, Systemized Swing Trading and through our Educational Courses and Videos... » Get More Info Now!
Shogun Trading's approach can benefit all stock traders, from day traders to long term swing traders. We are proud to show some of the best Performance in Day Trading, Longer Term Swing Trading Strategy, Systemized Swing Trading and through our Educational Courses and Videos... » Get More Info Now!
Trading Ideas & Picks
Trading Picks - Read More
HOLX: After a bullish gap up in late June, stock has been trading in a sideways range at the converged MAs. Stock surged below the support level intraday then traded two days at the lower end of the bearish colored candle, representing a consolidation and possible setup for further downside. Look to go short at...
Trading Ideas & Picks
Trading Picks - Read More
VRTX: The Fisher Transform provides sharper crossovers and more consistency in trends than most other indicators. Signals generated by the indicator are clear; when it is high and it begins moving down, short. When it is low, and it begins moving up, buy. Here’s an example, when strictly following the indicators...
Trading Ideas & Picks
Trading Ideas - Read More
AKAM: A light volume day today as this stock rests after a big move into new highs. A few more days of rest would be good and then I might consider some when and if the stock makes a new high at $39.60...
Trading Ideas - Read More
Trading Education Tutorial
Consolidations
Sideways Movement Gives Indication of Future Price Direction
Read More...
Consolidations
Sideways Movement Gives Indication of Future Price Direction
A consolidation is a place where buyers and sellers are very closely matched in numbers. As the battle ensues, others notice that the market is consolidating, and begin considering to get on board. As soon as a break from the consolidation occurs, the latent buyers or sellers usually begin taking positions.
Read More...
Daily Market Commentary
Updated Thursday, 8/3 for Friday's market
At Resistance
Read More...
Updated Thursday, 8/3 for Friday's market
| Key DOW Levels for 8/4 | |
| UP | Above 11,300 |
| DN | Below 11,075 |
At Resistance
- Dow rallies to key resistance at 11,250, watch for action at this level. The index closed the day challenging the key 11,250 resistance level and gained 43 points in the process. Watch key resistance for the next major move.
- The NASDAQ and S&P each pushed solidly higher from lows and are now testing key resistance. Watch resistance for a potentially big move tomorrow.
Summary
The Dow closed the day near the highs of the session after rallying from lows and is now testing key resistance at 11,250. If the index can break through 11,300 we will see big strength ahead. Otherwise, watch the lower trend line at 11,175 for early signs of weakness.
Read More...
NASDAQ Chart of the Day

Daily Trading Signals
DLTR has broken a clear upper trend line to the upside at 27.00 and looks very bullish. Look for continued upside movement from this pattern, especially if 29.00 is crossed and held.
Daily Trading Signals
NYSE Chart of the Day

Daily Trading Signals
VC has broken a clear channel consolidation to the upside at 7.50 and rallied to the close for a huge gain today. Look for continued overall strength from this pattern.
Daily Trading Signals
Thursday, August 03, 2006
Trading Ideas & Picks
Trading Ideas - Read More
OIH: This stock looks ready to move through the trendline and when it does that would be a good buy point and that price would be $147...
Trading Ideas - Read More
NASDAQ Chart of the Day

Daily Trading Signals
TSRA took a gap up this morning, but hit resistance at 35.50 and proceeded to drop. The stock now looks like it may form an exhaustion gap on high volume off resistance, which is bearish. Watch for weakness beneath 35.50.
Daily Trading Signals
NYSE Chart of the Day
Daily Trading Signals
DBD is holding beneath a clear resistance level at 41.00, which also happens to be the neck line of a clear inverted head-and-shoulders pattern, which is bullish. An upside break through 41.00 could lead to very nice strength.
Daily Trading Signals
Trading Ideas & Picks
Trading Picks - Read More
DRYS: An analyst upgrade and descending wedge breakout. The stock rose strongly and on high volume following a bullish analyst revision and it broke out of a large descending wedge...
Trading Education Tutorial
Measured and Exhaustion Gaps

Moving Averages Help Us Identify Trend Reversals
Read More...
Measured and Exhaustion Gaps
Moving Averages Help Us Identify Trend Reversals
There are three types of gaps that are of relevance to investors - the breakaway gap, the measured (or continuation) gap, and the exhaustion gap. We previously discussed the breakaway gap, but it is important to discuss the measured gap and exhaustion gap at the same time. Why? Because it is difficult to tell one from the other until after the fact.
Read More...
Daily Market Commentary
Updated Wednesday, 8/2 for Thursday's market
Rally back to 11,200
Read More...
Updated Wednesday, 8/2 for Thursday's market
| Key DOW Levels for 8/3 | |
| UP | Above 11,250 |
| DN | Below 11,075 |
Rally back to 11,200
- Dow rallies from yesterday's lows to close back at key 11,200 zone. The index closed the day with a very nice 74 point gain and continues to hold within the boundaries of a clear consolidation, which we will continue to watch for direction.
- The NASDAQ and S&P each rallied from yesterday's lows and continue to test upper boundaries. The S&P is clearly attempting at a big breakout, but further confirmation should be seen.
Summary
The Dow closed the day right at the top of the large trading range just beneath major resistance at 11,250. This zone will be huge in determining major direction. Look for a break or bounce in this zone for the next big move.
Read More...
Wednesday, August 02, 2006
Trading Education Tutorial
Hell's Triangle
Read More...
Hell's Triangle
The classic Descending Triangle illustrates the painful rollover from bull to bear market better than any other pattern. But why does it work with such deadly accuracy? Most traders don't understand how or why patterns predict outcomes. Some even believe these important tools rely on mysticism or convenient curve fitting. The simple truth is more powerful: congestion patterns in technical analysis reflect the impact of crowd psychology on changes in price and momentum.
Shock and fear quickly follow the first reversal marking a triangle's major top. But many shareholders remain true believers and expect their profits will return when selling dissipates. They continue to hold positions as hope slowly replaces better judgement. The selloff then carries further than anticipated and their discomfort increases. Just as pain begins to escalate, the correction suddenly ends and the stock firmly bounces.
For many longs, this late buying reinforces a dangerous bias that they were right all along. Renewed confidence even prompts some to add to positions. But smarter players have a change of heart and view this new rally as a chance to get out. As they quietly exit, the strong bounce loses momentum and the stock once again turns and fails. Those still riding the issue now watch the low of the first reversal with much apprehension...
Read More...
Trading Ideas & Picks
Trading Ideas - Read More
SU: This stock has super earnings and it could be ready to move through this small trendline when this past quarters earnings come out in a few days. I would consider this stock when it moves through the trendline at $83.50...
Trading Ideas - Read More
Trading Ideas & Picks
Trading Picks - Read More
AKAM: The stock rose strongly and on high volume in response to earnings... It also broke out of an ascending triangle pattern....
Daily Market Commentary
Updated Tuesday, 8/1 for Wednesday's market
Break & Decline
Read More...
Updated Tuesday, 8/1 for Wednesday's market
| Key DOW Levels for 8/2 | |
| UP | Above 11,250 |
| DN | Below 11,075 |
Break & Decline
- Dow breaks tight consolidation to downside, sells off throughout much of session. The index got a nice bounce to the Close, but still ended the day with a 60 point loss. The index is now holding above near-term support and continues to hold at the top of a very large trading range, which we will continue to watch..
- The NASDAQ and S&P sold off steadily throughout most of the session today, but are currently holding at clear support levels. Watch support closely for the next key move.
Summary
The Dow sold off steadily to begin the session today, but held firmly at support at 11,080. A break of this support level will signal much more weakness ahead. However, if the index can remain above this zone, we could see another test of the upper boundary of the large trading range at 11,250.
Read More...
Tuesday, August 01, 2006
NASDAQ Chart of the Day
Daily Trading Signals
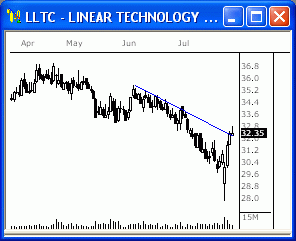
LLTC have penetrated above a downward sloping trend line near 32. This penetration marks a bullish change in trend and could lead to a rally back toward May highs. However, a failure to remain above 32 would suggest the overall downtrend remains intact. Such a reversal would likely trigger continued weakness back toward 28 and the resumption of the overall downtrend.
Daily Trading Signals
NYSE Chart of the Day

Daily Trading Signals
WMI has formed a downward sloping trend channel. A break above 35 would result in the penetration of the upper boundary of the trend channel. Such a break would mark a bullish resolution to the trend channel formation and could lead to re-test of May highs.
Daily Trading Signals
Technical Indicators
Momentum Indicator
Read More...TBy measuring the amount that a security's price has changed over a given time span, the Momentum indicator provides an indication of a market's velocity and to some degree, a measure of the extent to which a trend still holds true. It can also be helpful in spotting likely reversal points.
While the mathematics are straightforward (subtract the closing price n days ago from the closing price today), do not underrate its value because of its simplicity.
Use the Momentum indicator as a trend-following oscillator similar to the MACD and buy when the indicator bottoms and turns up. Sell when the indicator peaks and turns down. When the Momentum indicator reaches extremely high or low values (relative to historical values) assume a continuation of the current trend...
Daily Market Commentary
Updated Monday, 7/31 for Tuesday's market
Consolidation
Read More...
Updated Monday, 7/31 for Tuesday's market
| Key DOW Levels for 8/1 | |
| UP | Above 11,250 |
| DN | Below 11,050 |
Consolidation
- Dow tcontinues to trade near 10,200 level. The index never established a discernible bias and remained in tight consolidation till the Close. The Dow end today's session with an unremarkable loss of 37 points.
- The NASDAQ and S&P each continue to trade in close proximity to key resistance levels. The manner in which the indexes interact with levels will provided insight in future bias.
Summary
While the Dow failed to remain above 11,200, the overall trading outlook remains the same. We will continue to monitor 10,200 for an early indication of strength or weakness. Strength above would signal a bullish resolution and a return to May highs. Conversely, weakness below 10,200 could trigger a sharp decline back toward June lows.
Read More...
Trading Education Tutorial
Moving Averages and the Trend
Moving Averages Help Us Identify Trend Reversals
Read More...
Moving Averages and the Trend
Moving Averages Help Us Identify Trend Reversals
One of the old axioms of technical analysis is that 'the trend is your friend'. This holds true, as long as you trade in the direction of the trend. However, your 'friend' has two faces, and can turn on you to eliminate profits (and your friendship!). Trend reversals can occur at any time and one of the important skills a trader must possess is the ability to identify a reversal. It is easy to exit a position too early if we over-anticipate a trend reversal, and just as easy to watch our profits evaporate if we are too slow to exit the trade.
Read More...
Monday, July 31, 2006
Quantum Swing Trader
Limited Offer
Quantum Swing Trader - Limited Edition
If you had a stock trading method that let you discover when a stock was about to make a massive move UP or DOWN, and then showed you, step-by-step, how to take advantage of that move to potentially pull profits out of the markets... would you be interested?
The "sweet spot" of Quantum Swing Trader is that it shows you how to take just a few common indicators, but use them in an uncommon way to "pinpoint" the spot in any stock where it has a high probability of making a massive move UP or DOWN, but not stay the same.
* Quantum Swing Trader - Limited Edition*
Bill's only releasing 1,000 more copies to the trading community, and only from August 1 through August 15. He's doing this so he can make sure he can provide support and focus to his next group of students for his new course.
* Quantum Swing Trader - Limited Edition*
This course is HUGE. Here are some of the highlights:
** "Free Trade" strategy which is the goal of every trade he teaches you to place. This lets you get into a position and lock in some early profits.
** How to quickly scan over 8,000 stocks every night in seconds with Bill's search criteria to find the stocks that have a high- probability of entering into a potentially profitable position.
** Profit Feeder service, which "spoon feeds" you his highest-probability stocks every night.
** The 2 "cheat sheet" blueprints that summarize the entire method in one place so you don't need to spend hours hunting through the materials after you've studied it to find what you want.
** Spend no more than 20 minutes a night applying the method.
There's a ton more, including a dedicated section just for beginners, lifetime customer support, and some really unique bonuses, but you'll need to check out QST's web page to see everything for yourself:
Quantum Swing Trader - Limited Edition
NASDAQ Chart of the Day

Daily Trading Signals
LLTC has fulfilled an exhaustion gap on increased volume, which is bullish. Watch for strength above 32.00 for a continuation higher.
Daily Trading Signals
NYSE Chart of the Day

Daily Trading Signals
IRM got a huge upside break through a clear upper trend line at 36.50, which is very bullish. Watch for continued strength back toward the mid-40's.
Daily Trading Signals
Daily Market Commentary
Updated Friday, 7/28 for Monday's market
Gap and Go
Read More...
Updated Friday, 7/28 for Monday's market
| Key DOW Levels for 7/31 | |
| UP | Above 11,250 |
| DN | Below 11,050 |
Gap and Go
- Dow trades above 11,200 level. The early bullish momentum had faded and the index seemed content to consolidate near session highs for the remainder of the session. By the close, the Dow had retained the majority of its early gains and closed with a solid 119 point gain.
- The NASDAQ and S&P each displayed notable strength in early trading. As a result, both indexes are trading in close proximity to potential resistance area. The manner in which the indexes interact with these levels will likely provided an early indication of future bias
Summary
The Dow closed today's session strongly, trading firmly above its 11,200 resistance level. This is indeed a bullish development and may open the way for an advance back toward May highs. However, considering the magnitude of recent gains, we may witness a period consolidation and/or retracement as the index gears up for it its next advance or decline.
Read More...
Trading Education Tutorial
Volatility

Well Behaved Stocks Reap Rewards
Read More...
Volatility
Well Behaved Stocks Reap Rewards
Some stocks move multiple points and multiple directions in one trading session. Other stocks are more methodical in their day-to-day movement. Which type of stock is more attractive to you as an investor?
Read More...
![]()