Monday, July 17, 2006
NASDAQ Chart of the Day
Daily Trading Signals
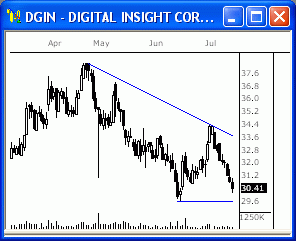
DGIN is trading near a potential support area near 29.5. A break below 29.5 would signify a bearish continuation move and a resumption of the over all downtrend which has persisted since late April. However, a break above 33.6 would indicate a bullish change in trend and could trigger a rally back toward April highs.
Daily Trading Signals
![]()